Around the end of 2020, I looked at GNOME's commit history as a proxy for the project's overall health. It was fun to do and hopefully not too boring to read. A year and a half went by since then, and it's time for an update.
If you're seeing these cheerful-as-your-average-wiphala charts for the first time, the previous post does a better job of explaining things. Especially so, the methodology section. It's worth a quick skim.
What's new
- Fornalder gained the ability to assign cohorts by file suffix, path prefix and repository.
- It filters out more duplicate authors.
- It also got better at filtering out duplicate and otherwise bogus commits.
- I added the repositories suggested by Allan and Federico in this GitHub issue (diff).
- Some time passed.
Active contributors, by generation
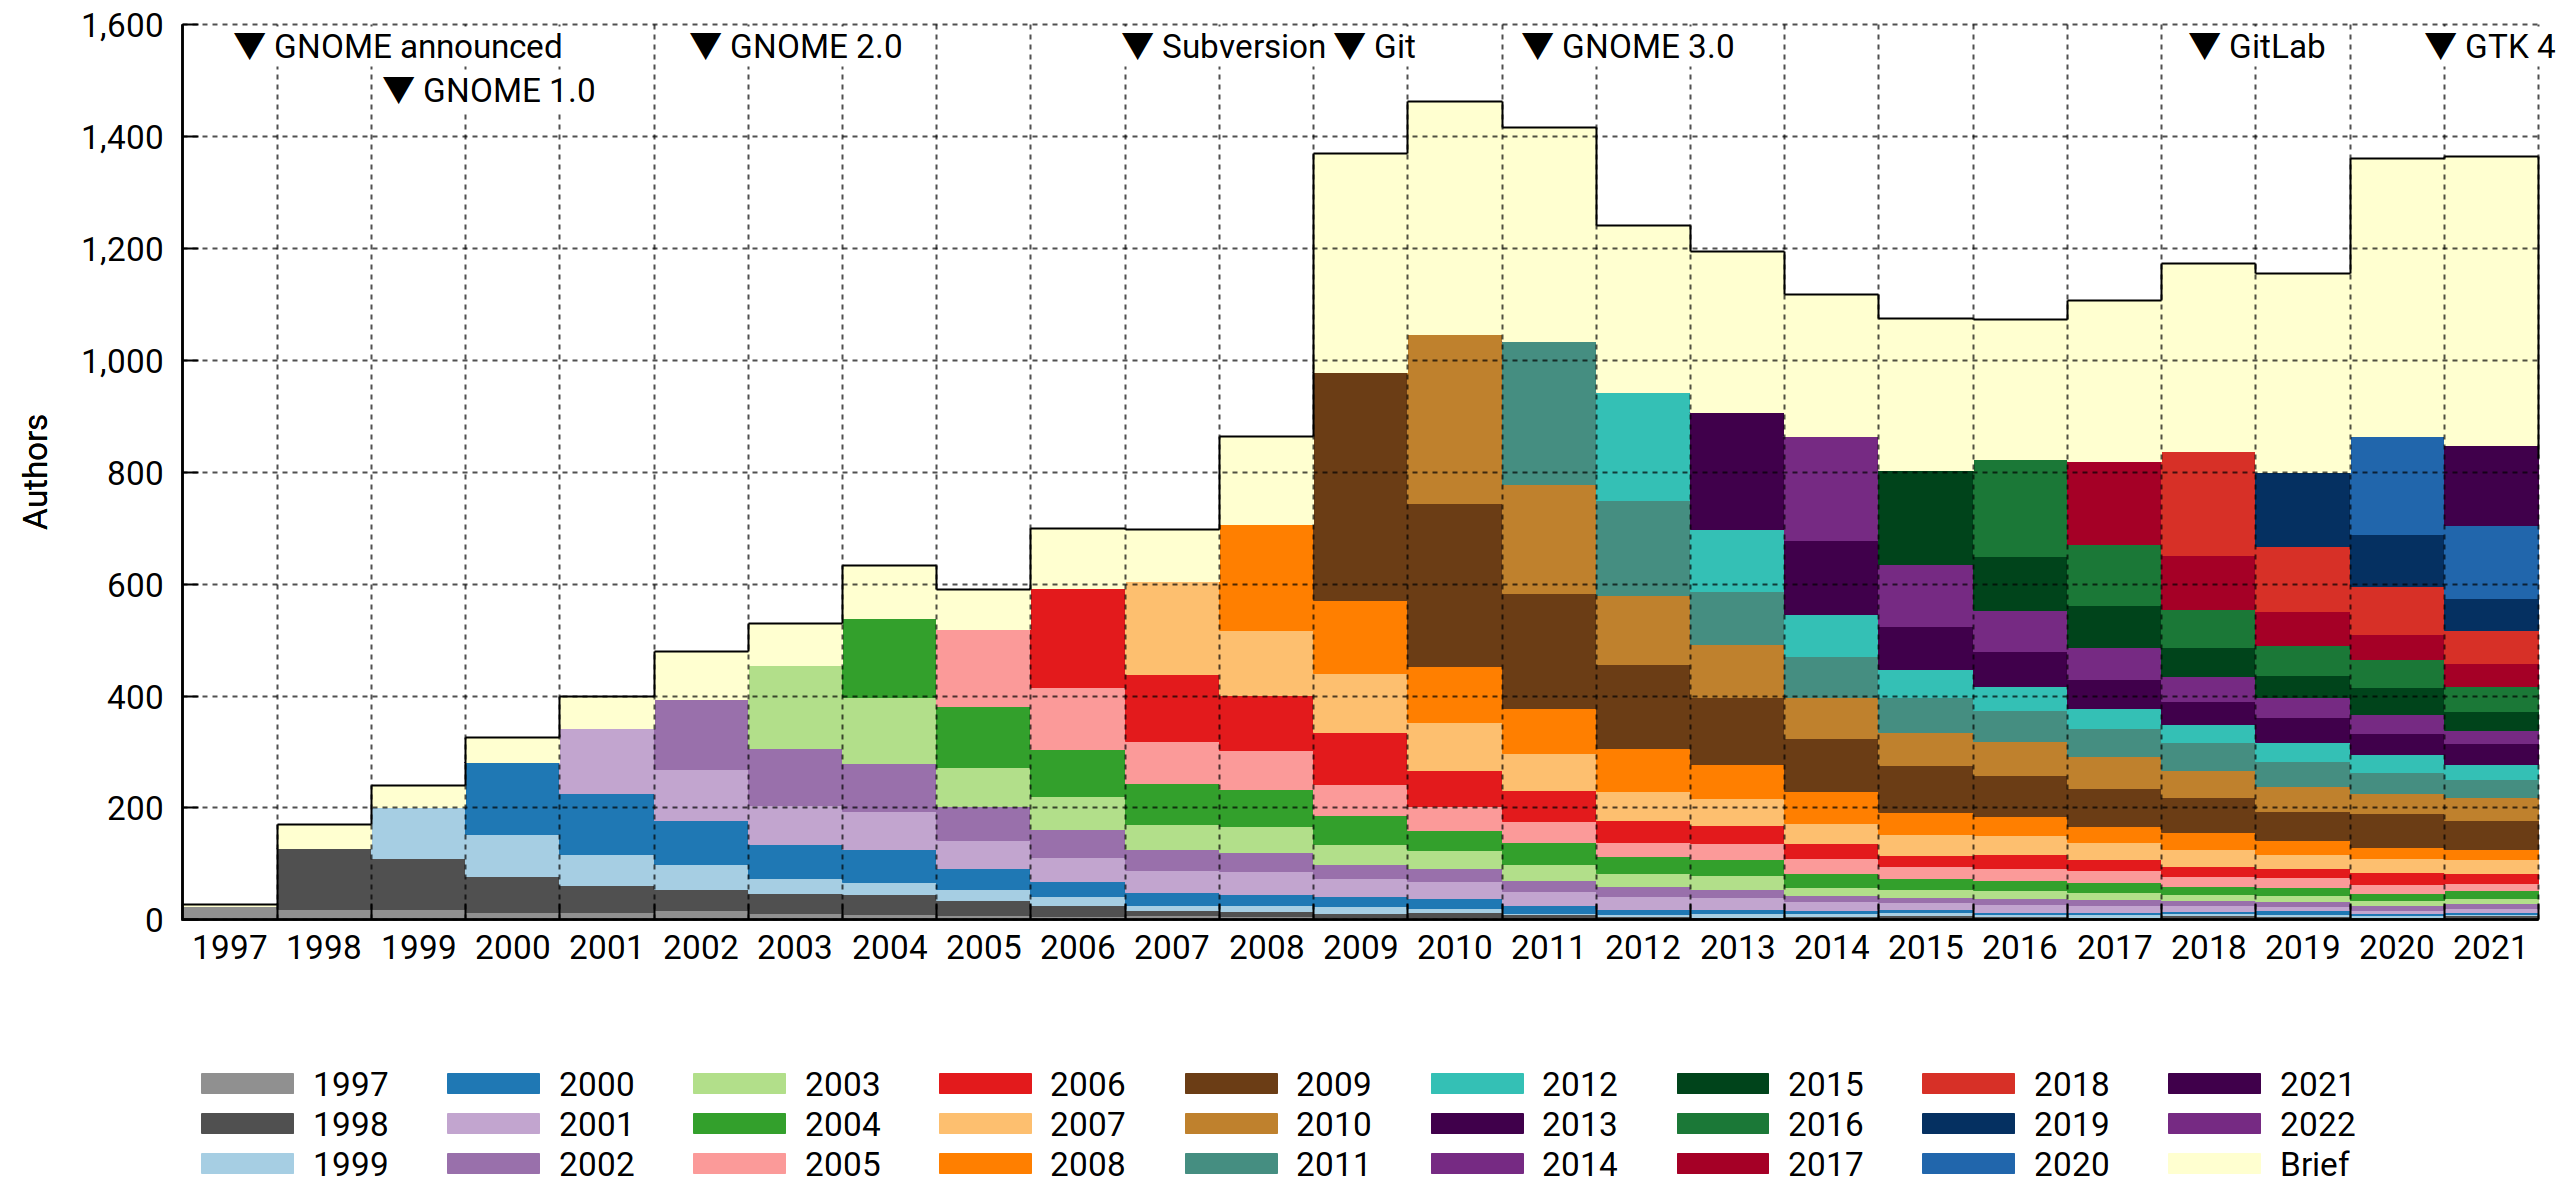
As expected, 2020 turned out interesting. First-time contributors were at the gates, numbering about 200 more than in previous years. What's also clear is that they mostly didn't stick around. The data doesn't say anything about why that is, but you could speculate that a work-from-home regime followed by a solid staycation is a state of affairs conductive to finally scratching some tangential — and limited — software-themed itch, and you'd sound pretty reasonable. Office workers had more time and workplace flexibility to ponder life's great questions, like "why is my bike shed the wrong shade of beige" or perhaps "how about those commits". As one does.
You could also argue that GNOME did better at merging pull requests, and that'd sound reasonable too. Whatever the cause, more people dipped their toes in, and that's unequivocally good. How to improve? Rope them into doing even more work! And never never let them go.
2021 brought more of the same. Above the 2019 baseline, another 200 new contributors showed up, dropped patches and bounced.
Active contributors, by affiliation

Unlike last time, I've included the Personal and Other affiliations for this one, since it puts corporate contributions in perspective; GNOME is a diverse, loosely coupled project with a particularly long and fuzzy tail. In terms of how spread out the contributor base is across the various domains, it stands above even other genuine community projects like GNU and the Linux kernel.
Commit count, by affiliation
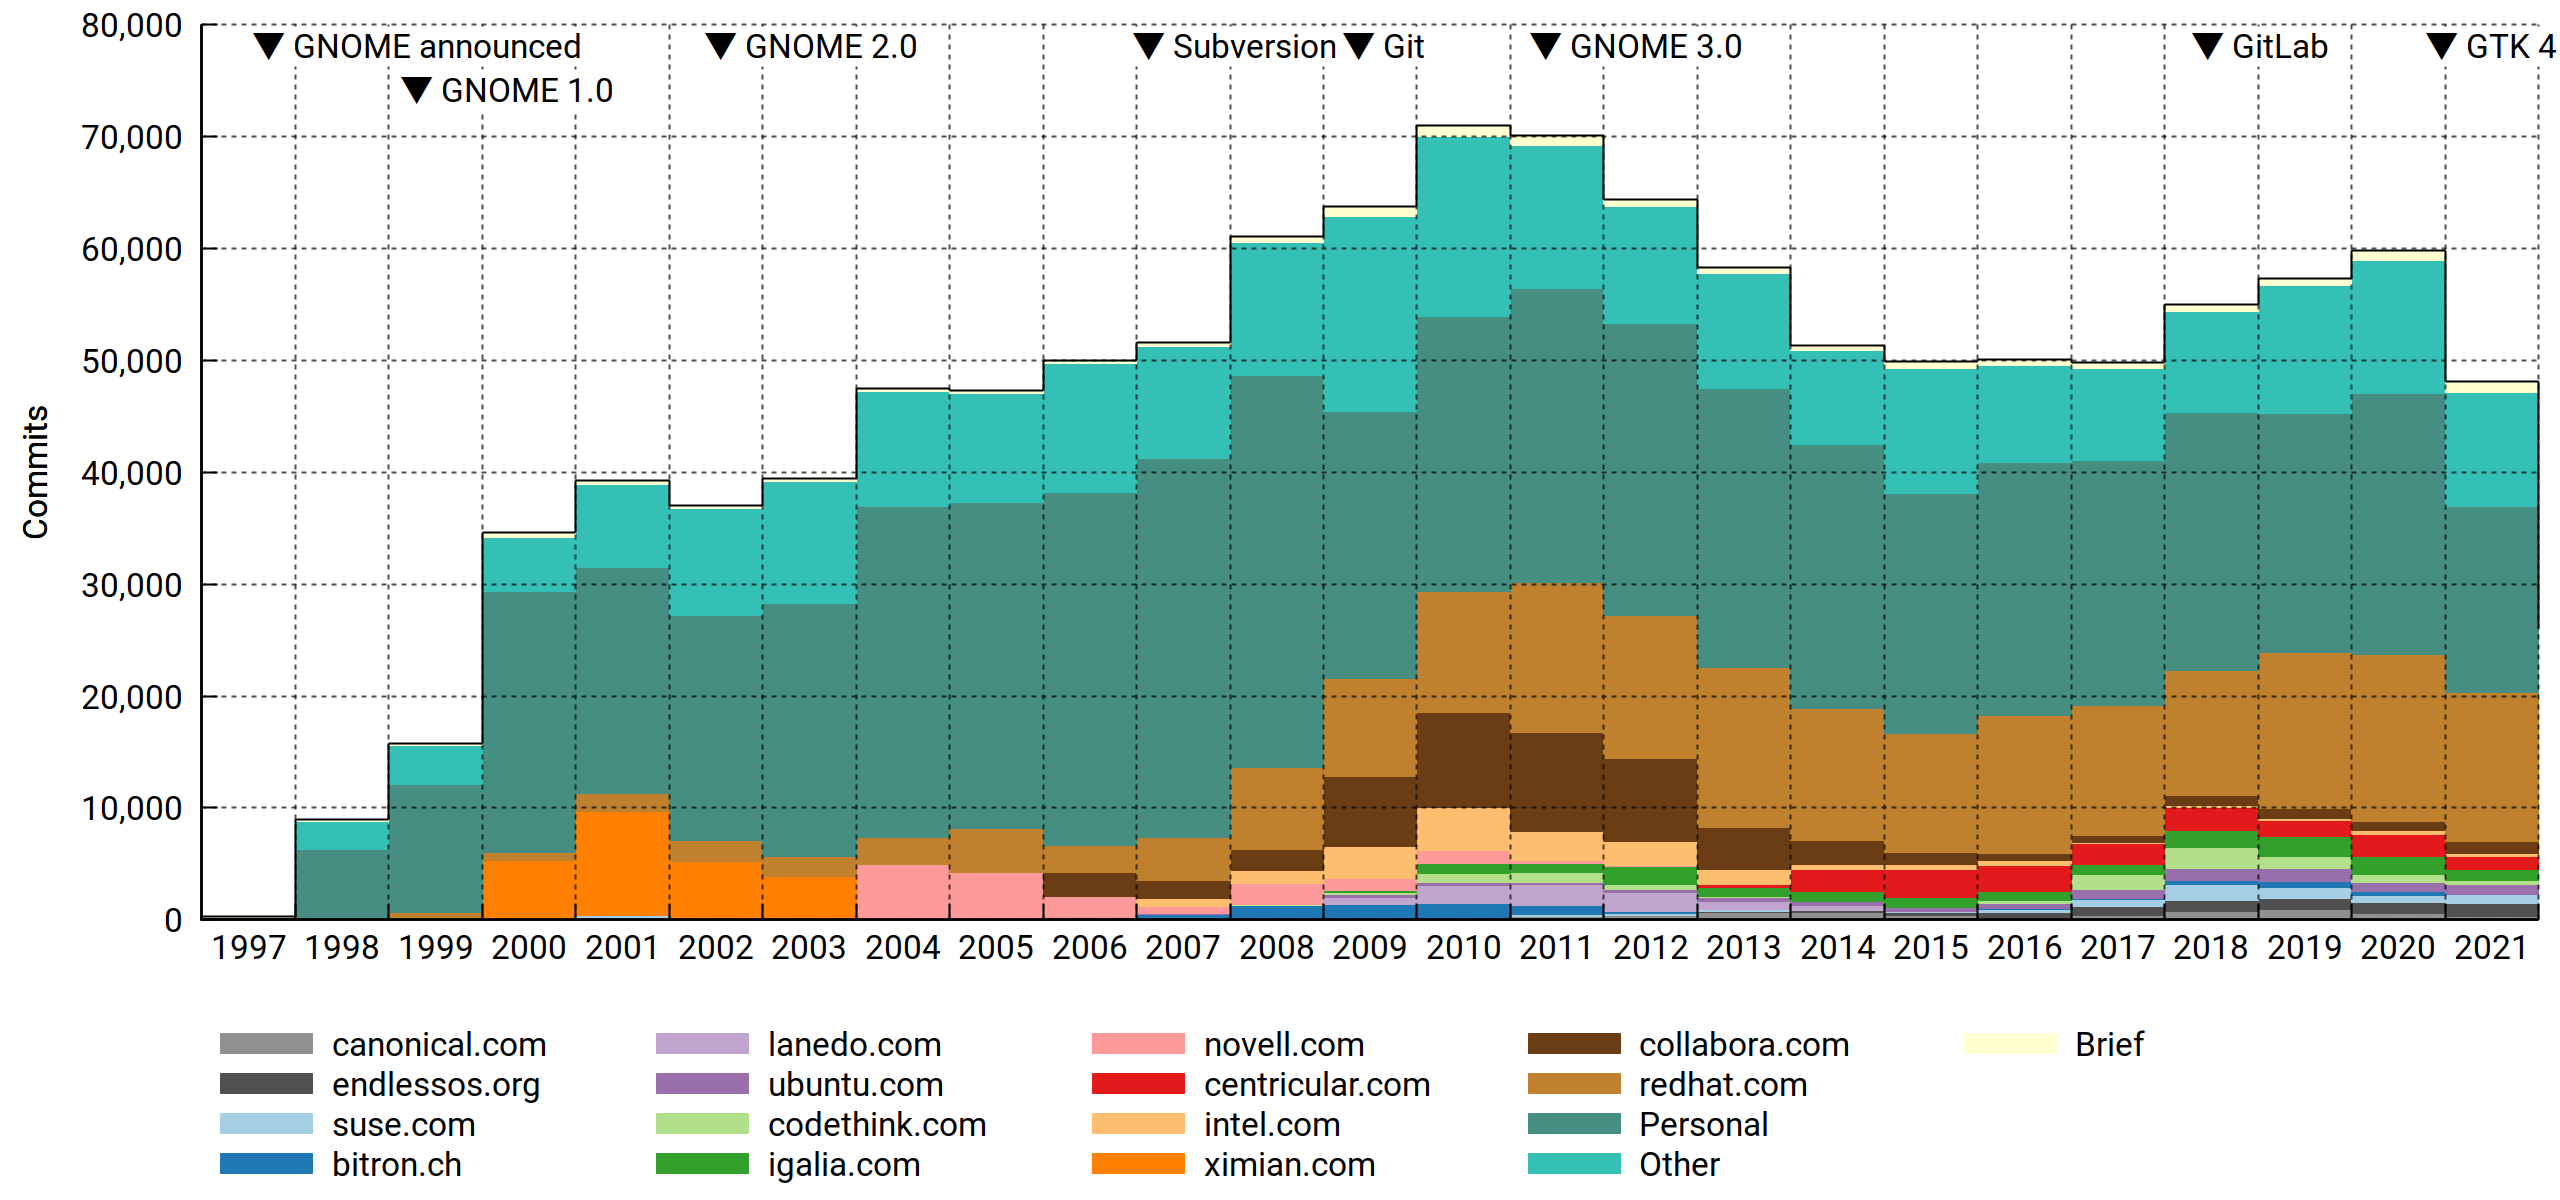
To be fair, the volume of contributions matters. Paid developers punch way above their numbers, and as we've seen before, Red Hat throws more punches than anyone. Surely this will go on forever (nervous laugh).
Eazel barely made the top-15 cut the last time around. It's now off the list. That's what you get for pushing the cloud, a full decade ahead of its time.
Active contributors, by repository
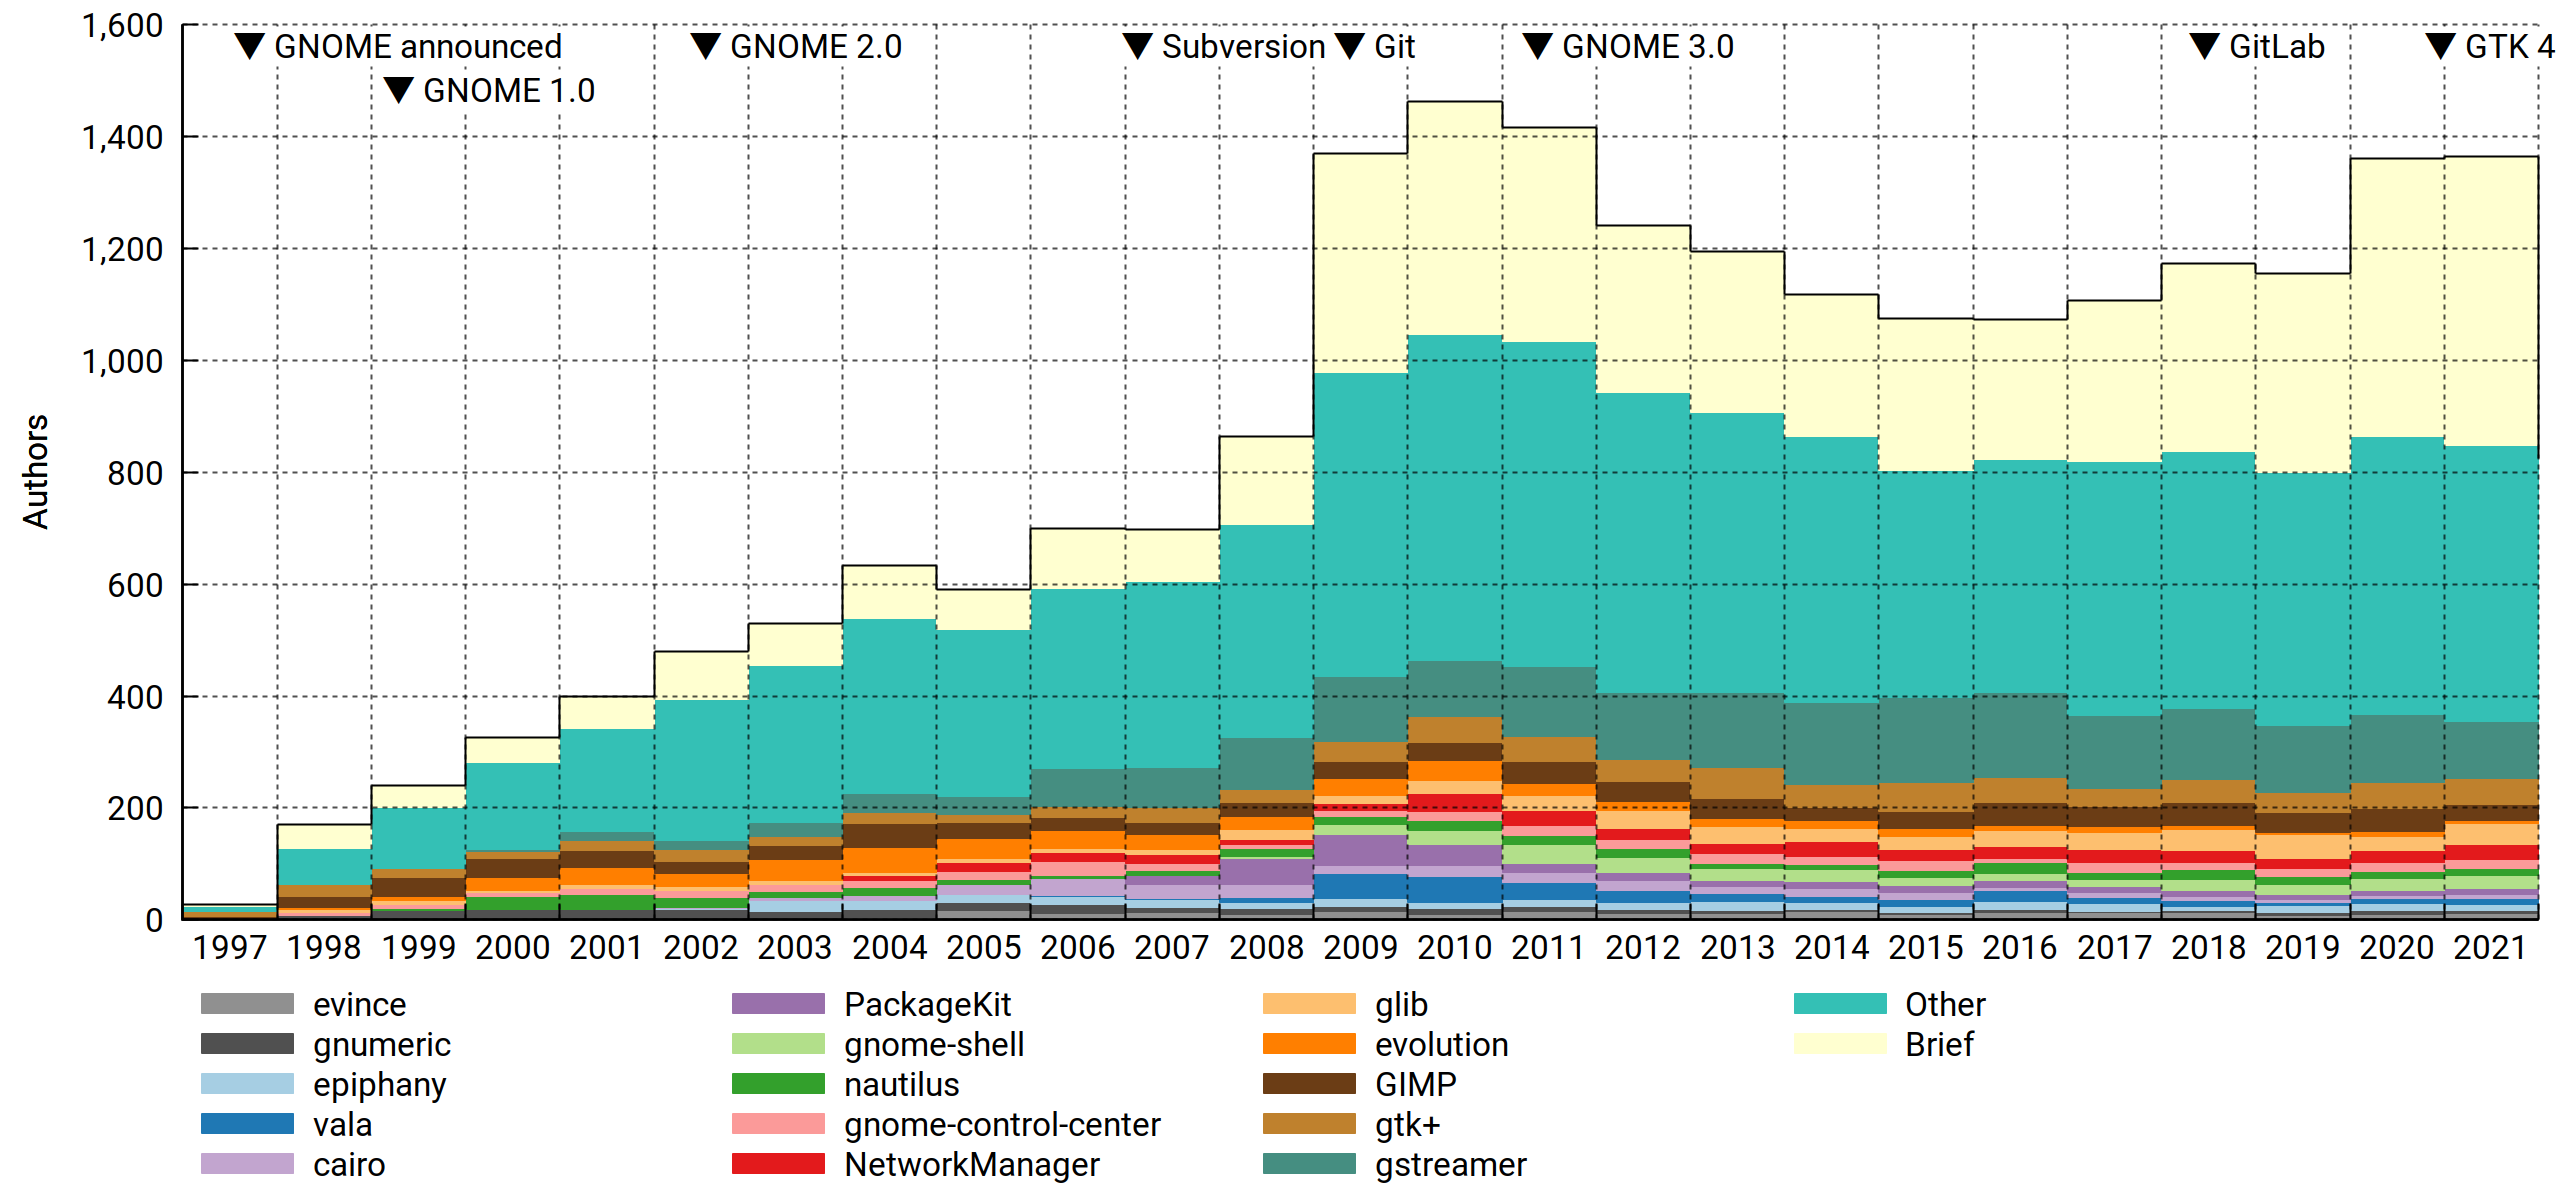
Slicing the data per repository makes for some interesting observations:
- Speaking of Eazel… Nautilus may be somewhat undermaintained for what it is, but it's seen worse. The 2005-2007 collapse was bad. In light of this, the drive to reduce complexity (cf. eventually removing the compact view etc) makes sense. I may have quietly gnashed my teeth at this at one point, but these days, Nautilus is very pleasant to use for small tasks. And for Big Work, you've got your terminal, a friendly shell and the GNU Coreutils. Now and forever.
- Confirming what "everyone knows", the maintainership of Evolution dwindled throughout the 2010s to the point where only Milan Crha is heroically left standing. For those of us who drank long and deep of the kool-aid it's something to feel apprehensive (and somewhat guilty) about.
- Vala played an interesting part in the GNOME infrastructure revolution of 2009-2011. Then it sort of… waned? Sure, Rust's the hot thing now, but I don't think it could eat its entire lunch.
- GLib is seriously well maintained!
Commit count, by repository

With commit counts, a few things pop out that weren't visible before:
- There's the not at all conspicuously named Tracker, another reminder of how transformative the 2009-2011 time frame really was.
- The mid-2010s come off looking sort of uneventful and bland in most of the charts, but Builder bucked that trend bigly.
- Notice the big drop in commits from 2020 to 2021? It's mostly just the GTK team unwinding (presumably) after the 4.0 release.
Active contributors, by file suffix
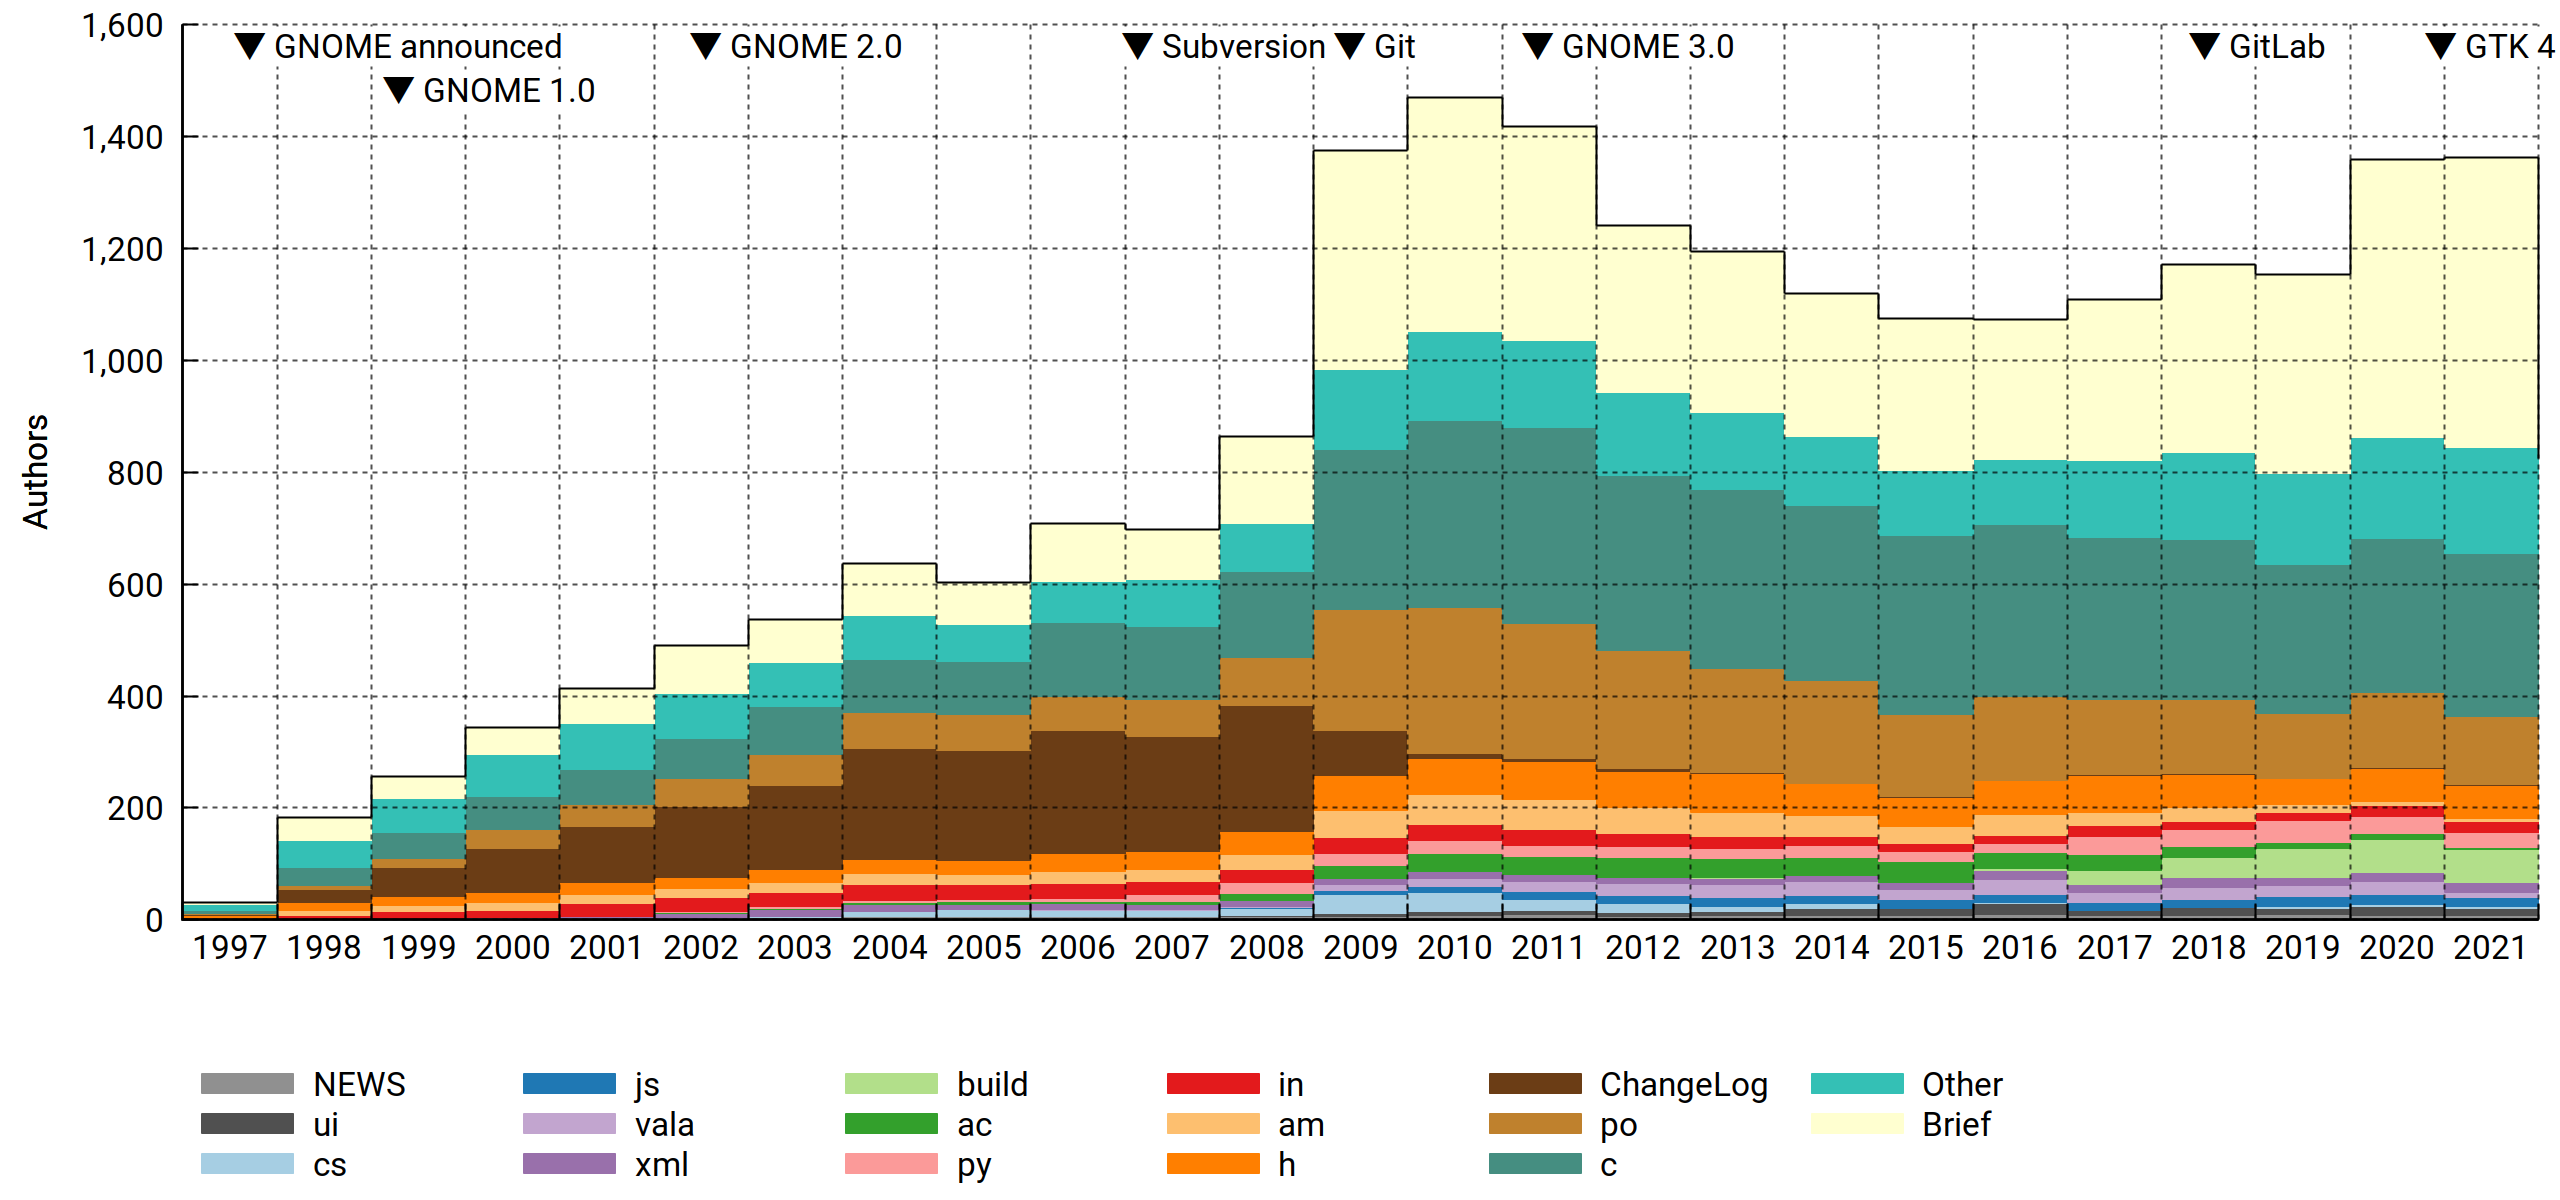
I devised this one mainly to address a comment from Smeagain. It's a valid concern:
There are a lot of people translating with each getting a single commit for whatever has been translated. During the year you get larger chunks of text to translate, then shortly before the release you finish up smaller tasks, clean up translations and you end up with lots of commits for a lot of work but it's not code. Not to discount translations bit you have a lot of very small commits.
I view the content agnosticism as a feature: We can't tell the difference in work investment between two code commits (perhaps a one-liner with a week of analysis behind it vs. a big chunk of boilerplate being copied in from some other module/snippet database), so why would we make any assumptions about translations? Maybe the translator spent an hour reviewing their strings, found a few that looked suspicious, broke out their dictionary, called a friend for advice on best practice and finally landed a one-line diff.
Therefore we treat content type foo the same as content type bar, big commits the same as small commits, and when tallying authors, few commits the same as many — as long as you have at least one commit in the interval (year or month), you'll be counted.
However! If you look at the commit logs (and relevant infrastructure), it's pretty clear that hackers and translators operate as two distinct groups. And maybe there are more groups out there that we didn't know about, or the nature of the work changed over time. So we slice it by content type, or rather, file suffix (not quite as good, but much easier). For files with no suffix separator, the suffix is the entire filename (e.g. Makefile).
A subtlety: Since each commit can touch multiple file types, we must decide what to do about e.g. a commit touching 10 .c files and 2 .py files. Applying the above agnosticism principle, we identify it as doing something with these two file types and assign them equal weight, resulting in .5 c commits and .5 py commits. This propagates up to the authors, so if in 2021 you made the aforementioned commit plus another one that's entirely vala, you'll tally as .5 c + .5 py + 1.0 vala, and after normalization you'll be a ¼ c, ¼ py and ½ vala author that year. It's not perfect (sensitive to what's committed together), but there are enough commits that it evens out.
Anyway. What can we tell from the resulting chart?
- Before Git, commit metadata used to be maintained in-band. This meant that you had to paste the log message twice (first to the ChangeLog and then as CVS commit metadata). With everyone committing to ChangeLogs all the time, it naturally (but falsely) reads as an erstwhile focal point for the project. I'm glad that's over.
- GNOME was and is a C project. Despite all manner of rumblings, its position has barely budged in 25 years.
- Autotools, however, was attacked and successfully dethroned. Between 2017 and 2021,
acandamgradually yielded to Meson'sbuild. - Finally, translators (
po) do indeed make up a big part of the community. There's a buried surprise here, though: Comparing 2010 to 2021, this group shrank a lot. Since translations are never "done" — in fact, for most languages they are in a perpetual state of being rather far from it — it's a bit concerning.
The bigger picture
I've warmed to Philip's astute observation:
Thinking about this some more, if you chop off the peak around 2010, all the metrics show a fairly steady number of contributors, commits, etc. from 2008 through to the present. Perhaps the interpretation should not be that GNOME has been in decline since 2010, but more that the peak around 2010 was an outlier.
Some of the big F/OSS projects have trajectories that fit the following pattern:
f (x) = ∑ [n = 1:x] (R * (1 – a)(n – 1))
That is, each year R new contributors are being recruited, while a fraction a of the existing contributors leave. R and a are both fairly constant, but since attrition increases with project size while recruitment depends on external factors, they tend to find an equilibrium where they cancel each other out.
For GNOME, you could pick e.g. R = 130 and a = .15, and you'd come close. Then all you'd need is some sharpie magic, and…
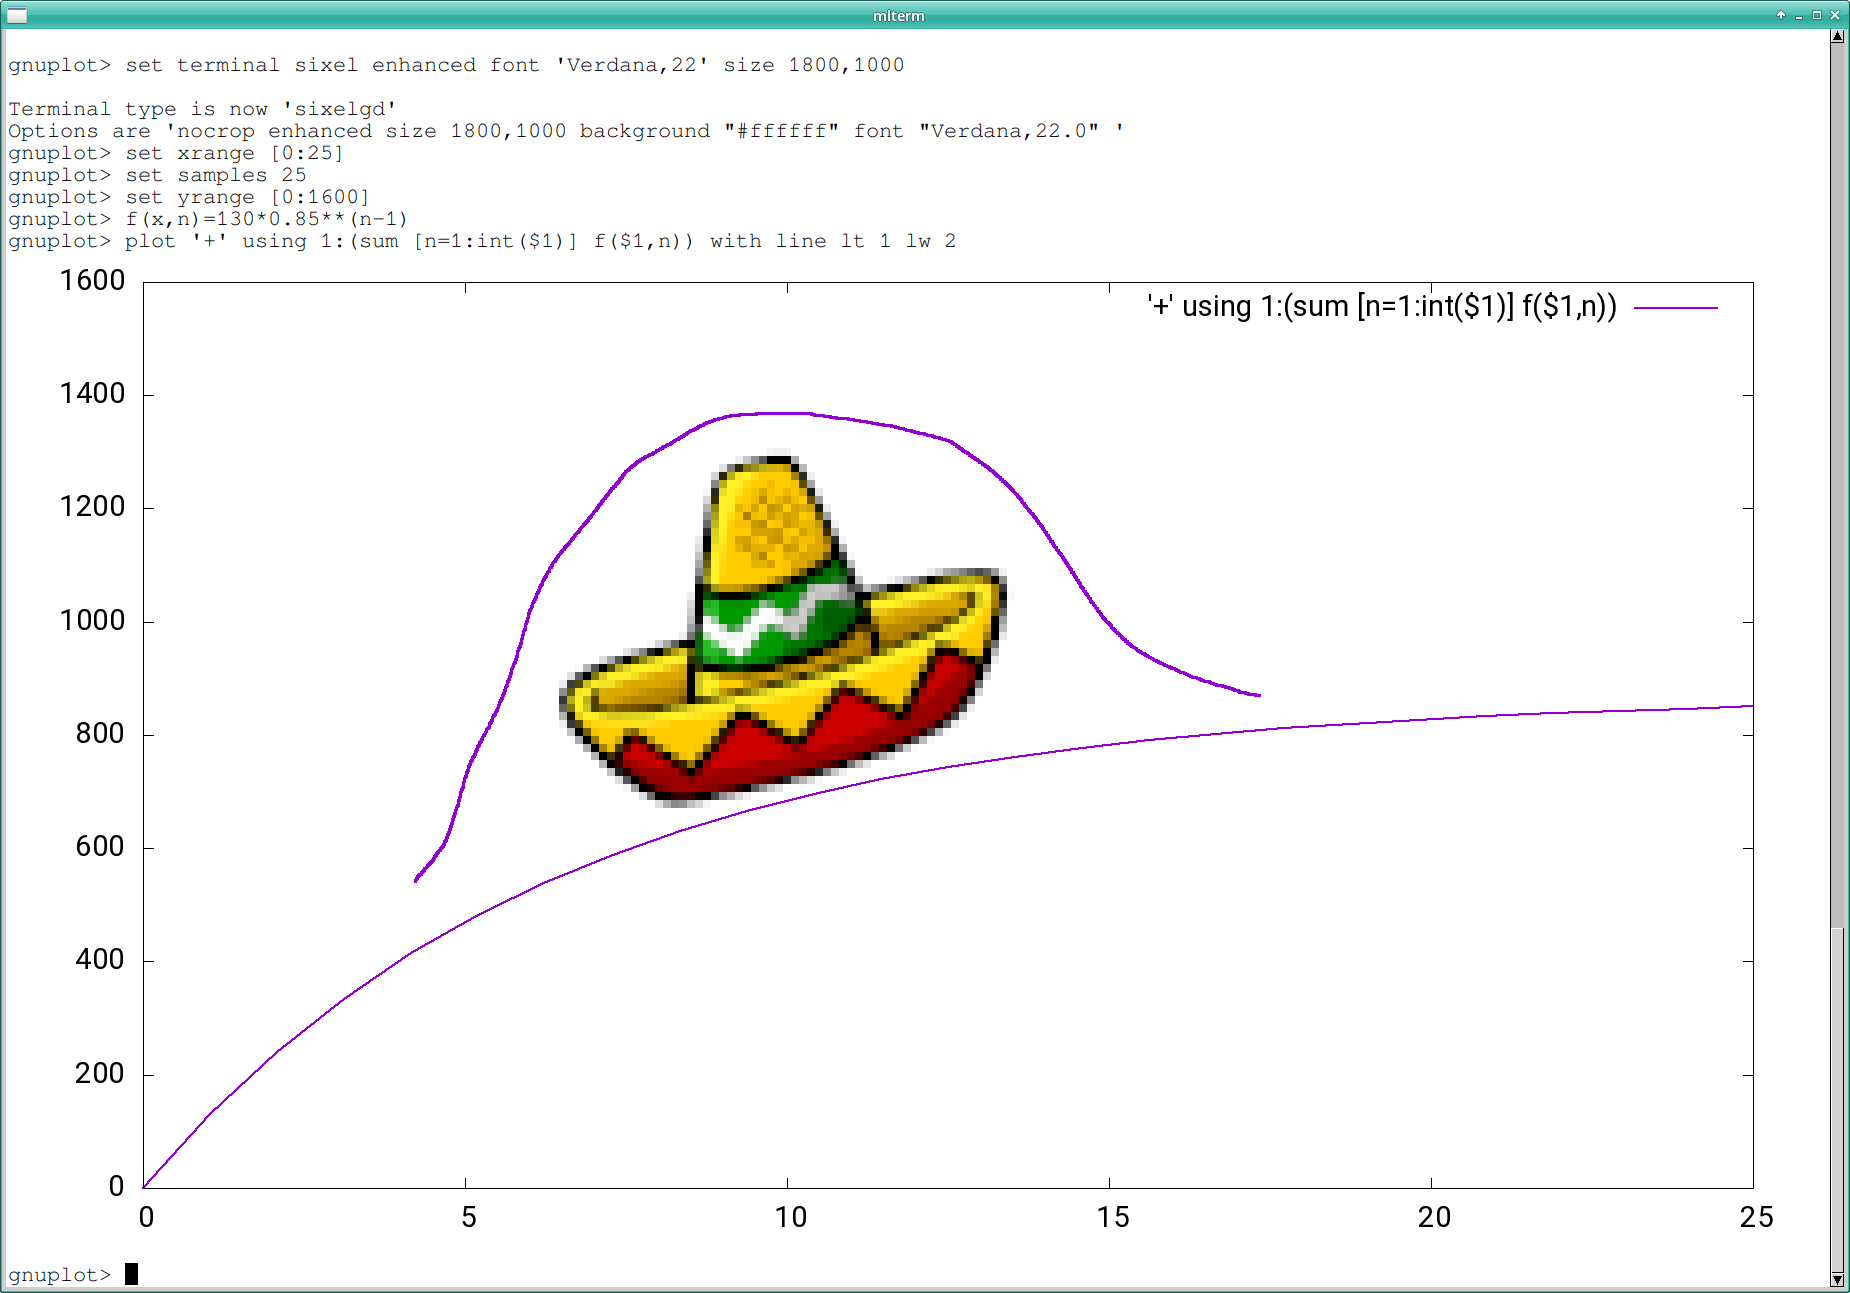
Not a bad fit. Happy 25th, GNOME.
"First-time contributors were at the gates, numbering about 200 more than in previous years. What's also clear is that they mostly didn't stick around. The data doesn't say anything about why that is"
Why not fire out a survey to all contributors, including those that didn't stick around, to find out? Getting out any, if all, frustrations is one of the ways to improve the project.
That's a good idea. The Git project did detailed user surveys early on when it was getting flak for being too hard to use. I think it helped, if nothing else to defuse accusations that they weren't listening.
I imagine the process could look something like:
– Create a standardized survey with open-ended questions like "Would you consider contributing again? Why/why not? How could we improve?"
– Collect the e-mail addresses of people who got their first patches merged at the end of every month/quarter. Send them the survey.
– Have someone collect the responses, read them and produce a report for developers.
Is there any way to tell or infer if those one time contributors where people sending a one time patch, or people that wanted to do more work with the community and for some reason decided not to?
I suspect there is no way to check that with this data.
Correct, the data doesn't say. All we know is that the contribution got merged and then there were no more contributions from that person.