The GNOME project turned 23 this year, and despite equally persistent rumors to the contrary, it's still alive and kicking.
Just how alive, though? All I know is this: Where the topic of GNOME's health goes, accurate data rarely follows. Of course, there is data — lots of it in fact, in public source code repositories. Though flawed in many ways, it allows us to make comparisons to the past — and maybe predictions for the future: Are a few organizations carrying most of the workload, making them critical points of failure? Are new contributors able to pick up the slack from those who leave? Is the project graying (i.e. increasingly dominated by veterans)?
In one of my occasional fits of hubris, I set out to process this data to see if I could shake out anything meaningful. I'm usually fine with just satisfying my own curiosity and leaving it at that, but it's one of those times where the results seem interesting enough for a blog post. So here we are.
I'm going to lead with the nice graphs and follow on with a section on methodology. The latter is long, boring, and mandatory reading.
Active contributors
By generation
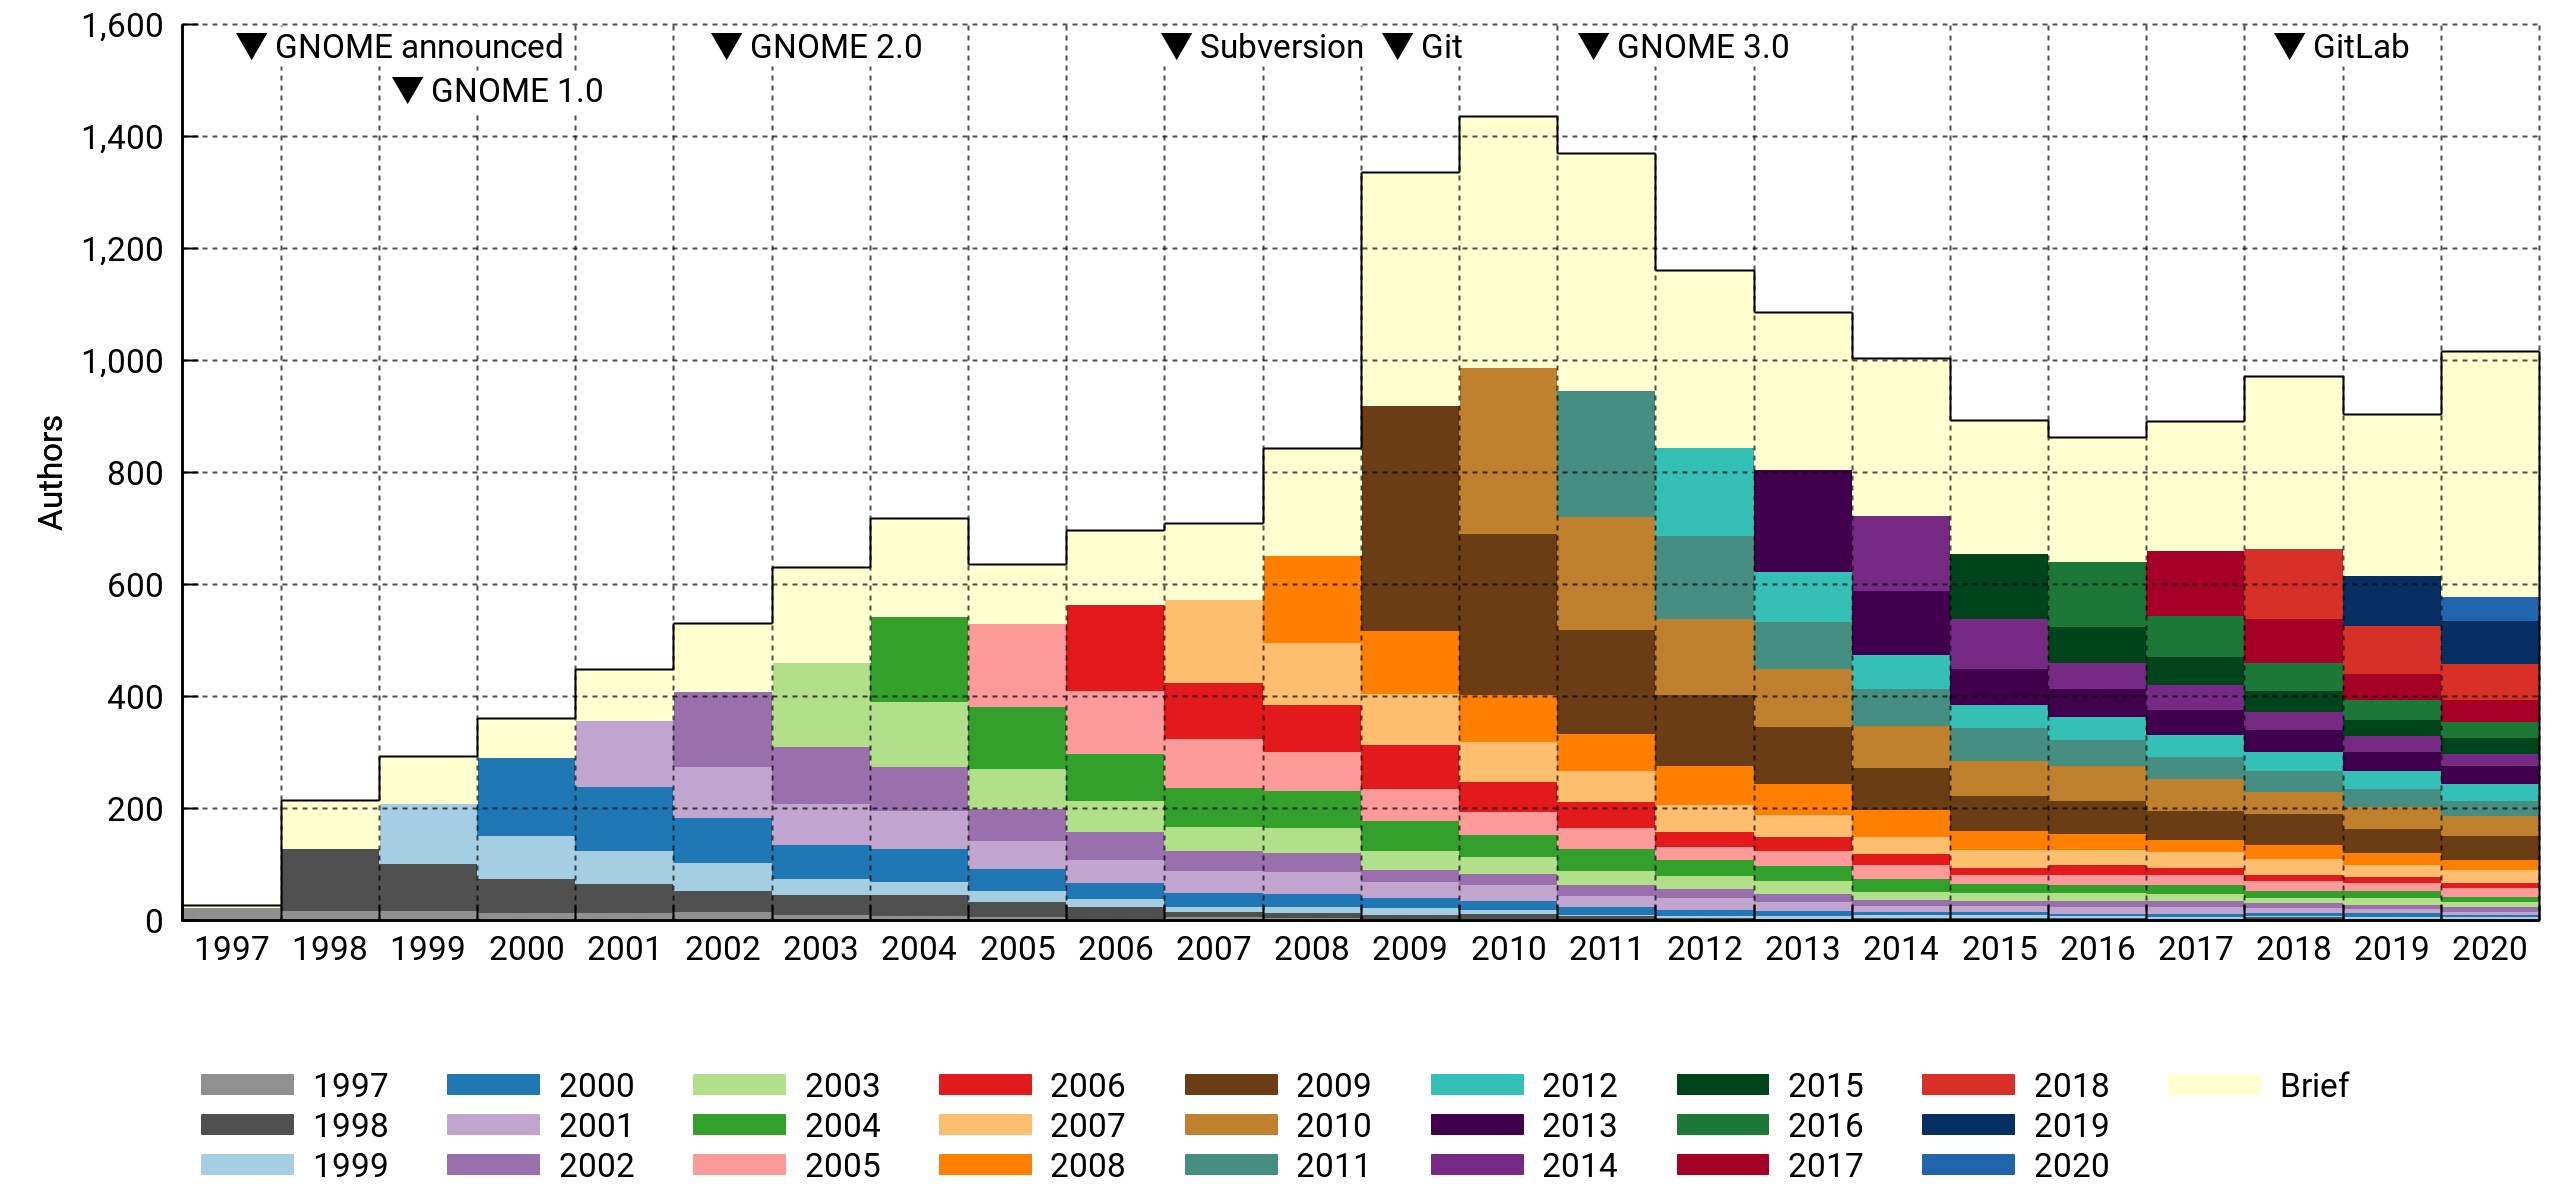
The stacked histogram above shows the number of contributors who touched the project on a yearly basis. Each contributor is assigned to a generational cohort based on the year of their first contribution. The cohorts tend to shrink over time as people leave.
There's a special "drive-by" cohort (in a fetching shade of off-white) for contributors who were only briefly involved, meaning all their activity fits in a three-month window. It's a big group. In a typical year, it numbers 200-400 persons who were not seen before or since. Most of them contribute a single commit.
According to this, GNOME peaked at slightly above 1,400 contributors in 2010 and went into decline with the GNOME 3.0 release the following year. However, 2020 saw the most contributors in a long time, even with preliminary data — there's still two weeks to go. Who knows if it's an anomaly or not. It's been an atypical year across the board.
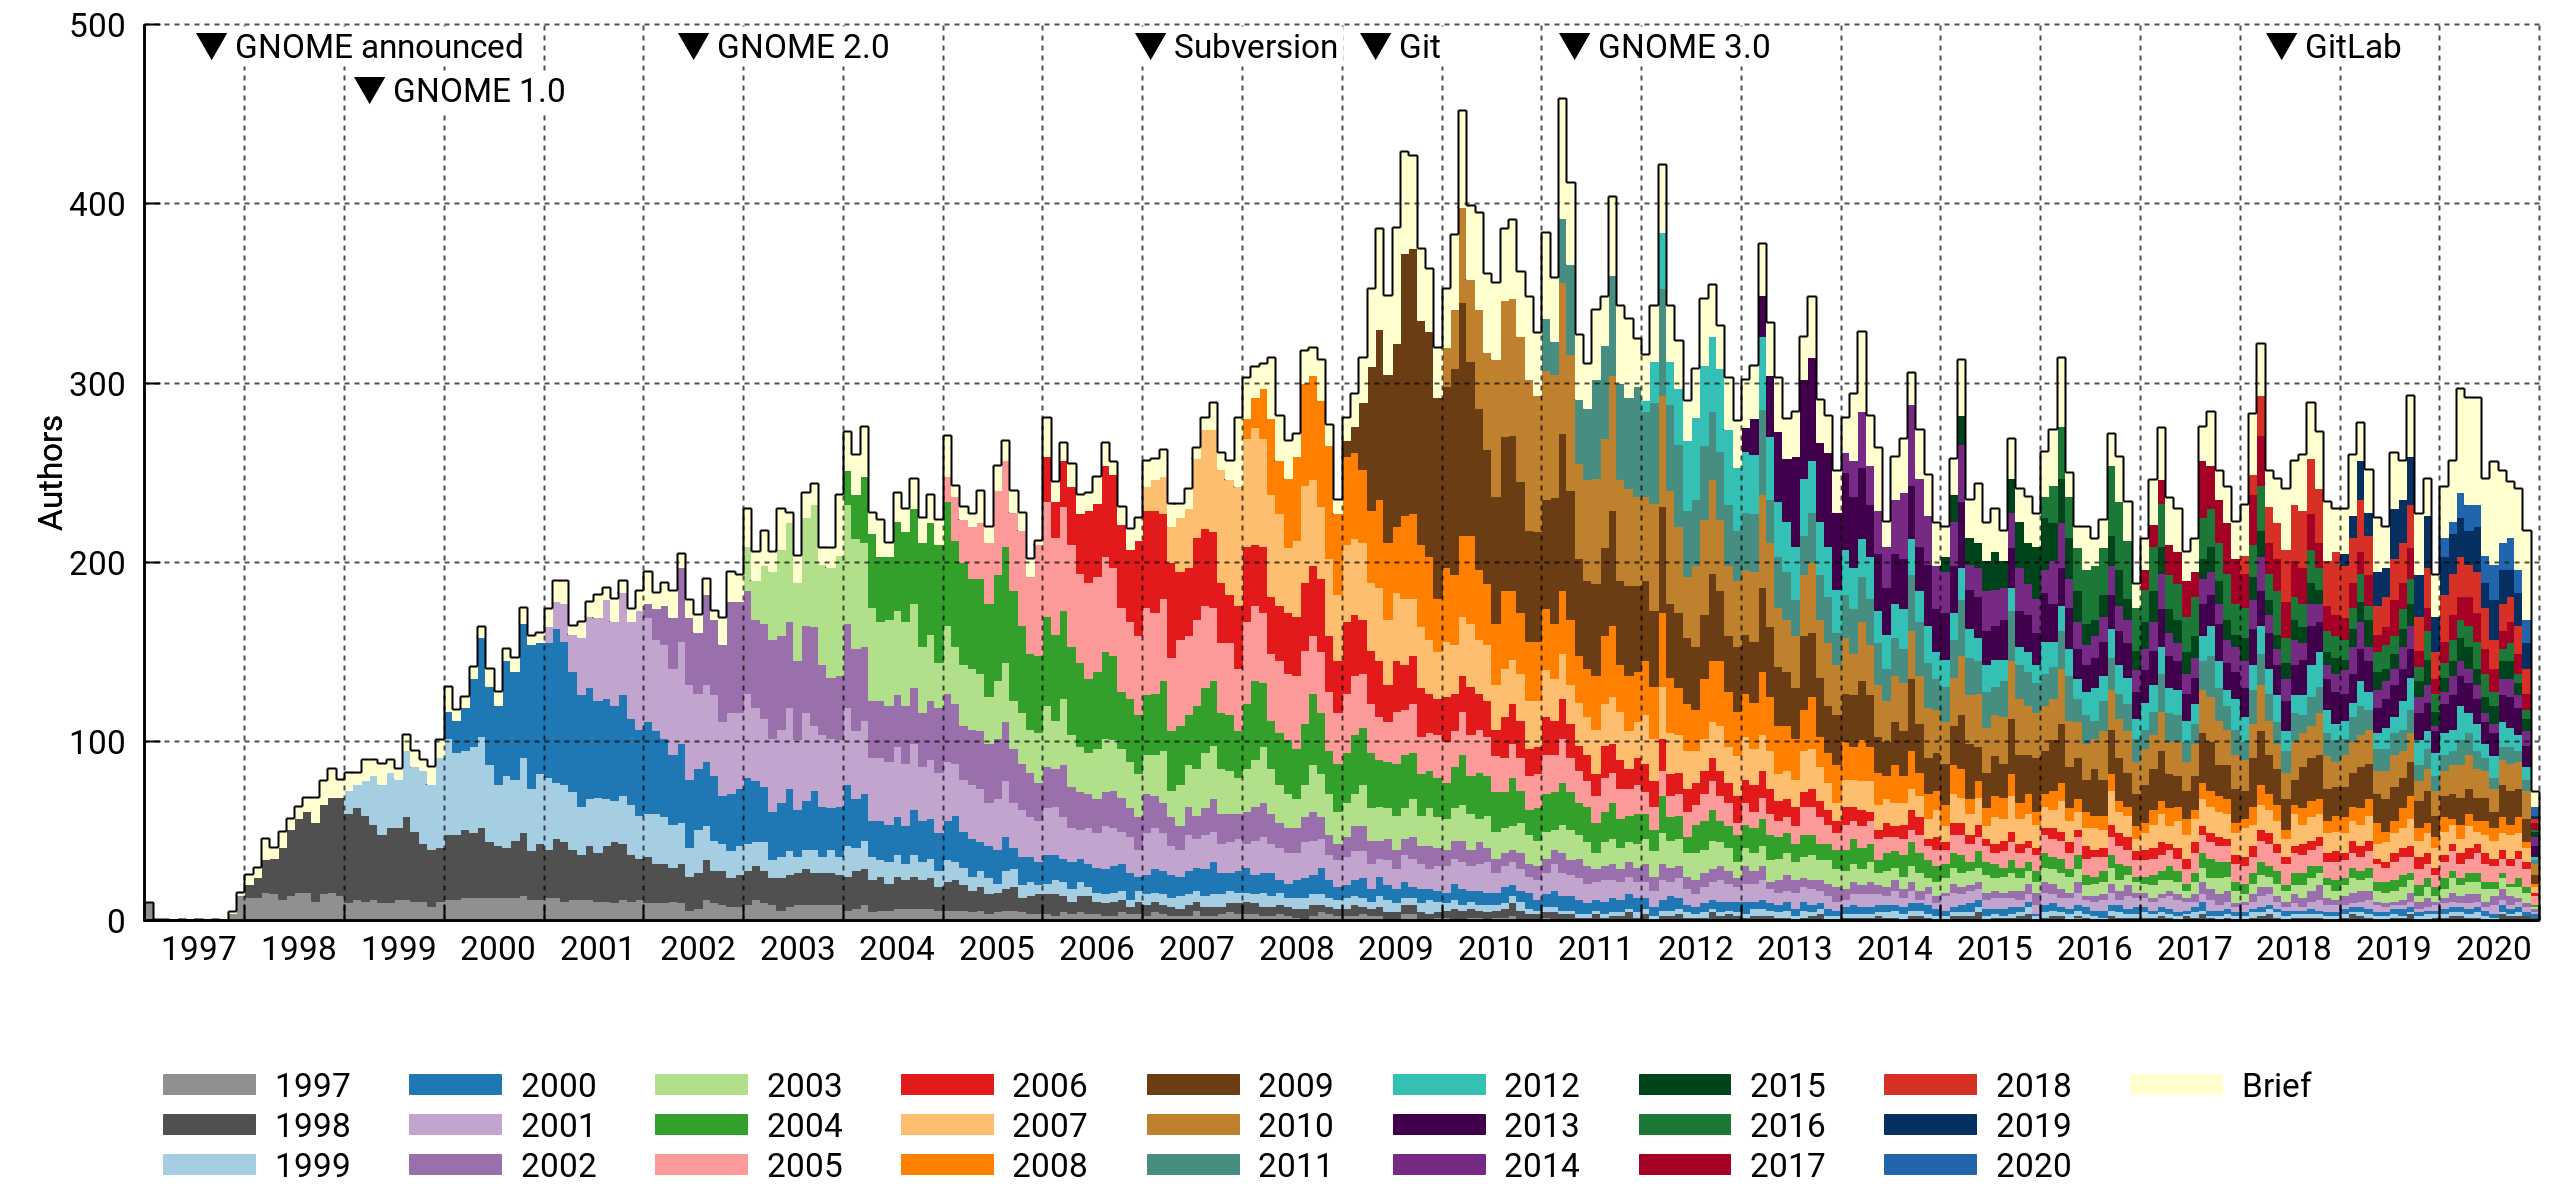
This is the same histogram, but with per-month bins. There's a clear periodicity caused by the semiannual release cycle. The peak month was March 2011, right before the GNOME 3.0 release. About 450 contributors got involved that month.
The drive-by cohort is relatively smaller on a monthly basis. This makes sense, as it has little overlap from month to month, and the per-year bins tend to add them all up.
By affiliation
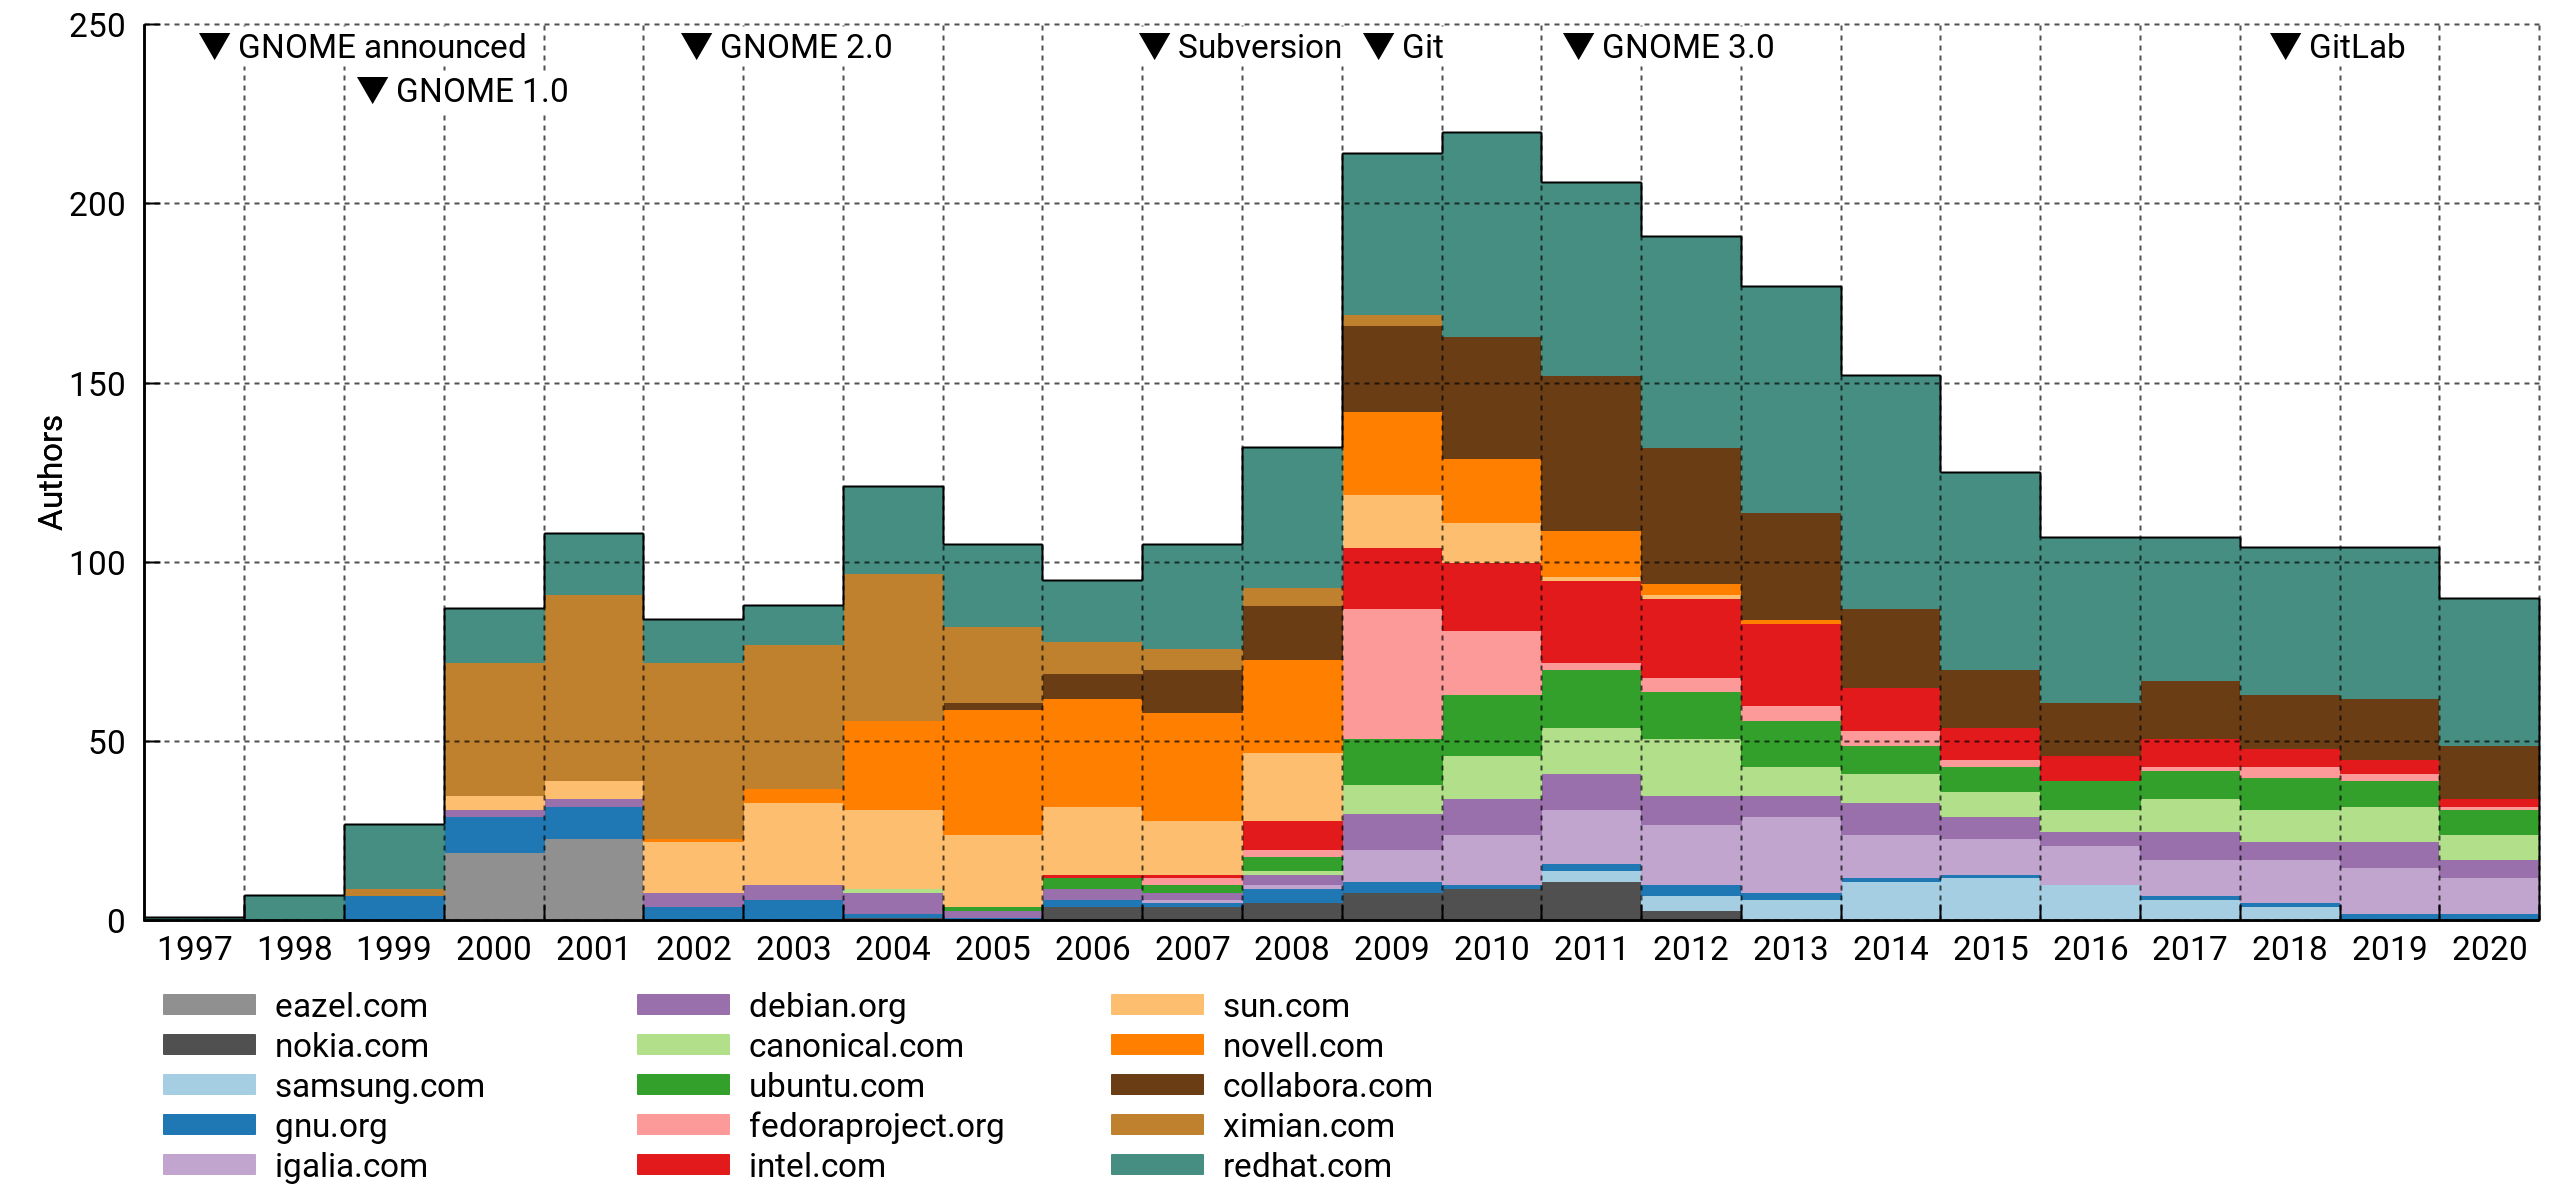
Above, the top 15 affiliations of active contributors. I've excluded personal accounts. This is pretty flawed (details below), but interesting nonetheless. For what it's worth, it mostly lines up with my memory of things.
The pattern tracks well with the total despite only capturing a minority portion of it. I think this means that paid and unpaid contributions are driven by the same underlying trends, or that there's a lot of the former hiding in the latter.
Commit count
By generation
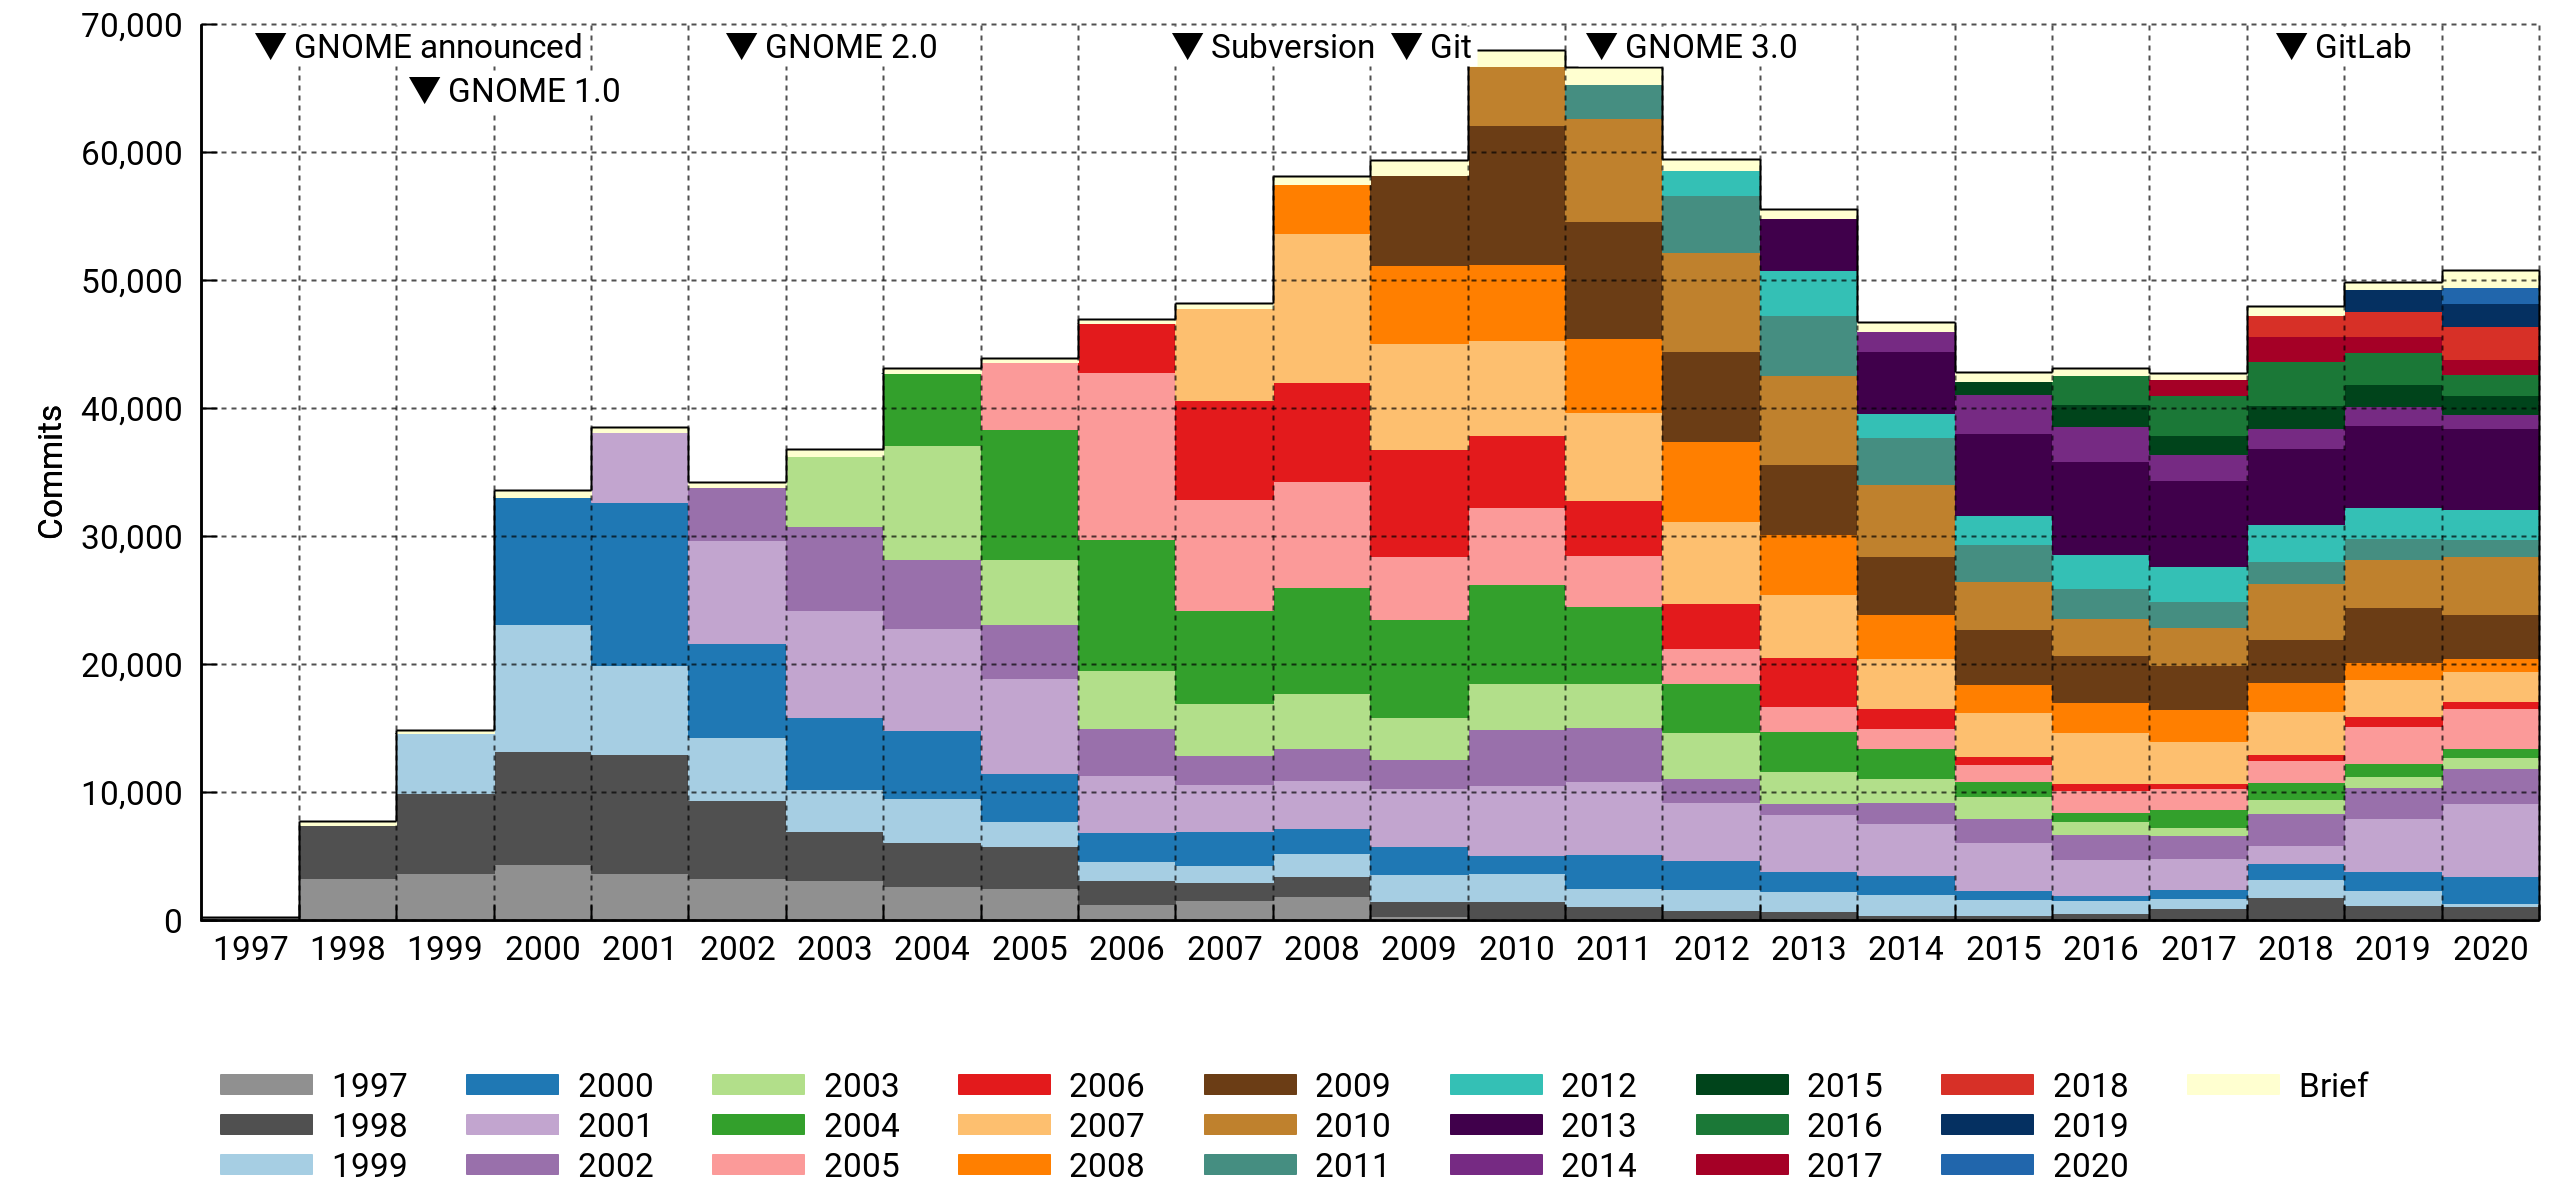
Here I'm counting the number of commits per year in the various cohorts.
At first glance, this looks much less dire. However, note how newcomers are having a smaller impact, especially from 2014 on. And the 2018-2020 bounce is entirely due to a handful of veterans making a comeback.
Half the commits in 2020 were made by contributors who've been with the project for ten years or more. Also noteworthy, drive-by commits are a vanishingly small portion of the total.
By affiliation
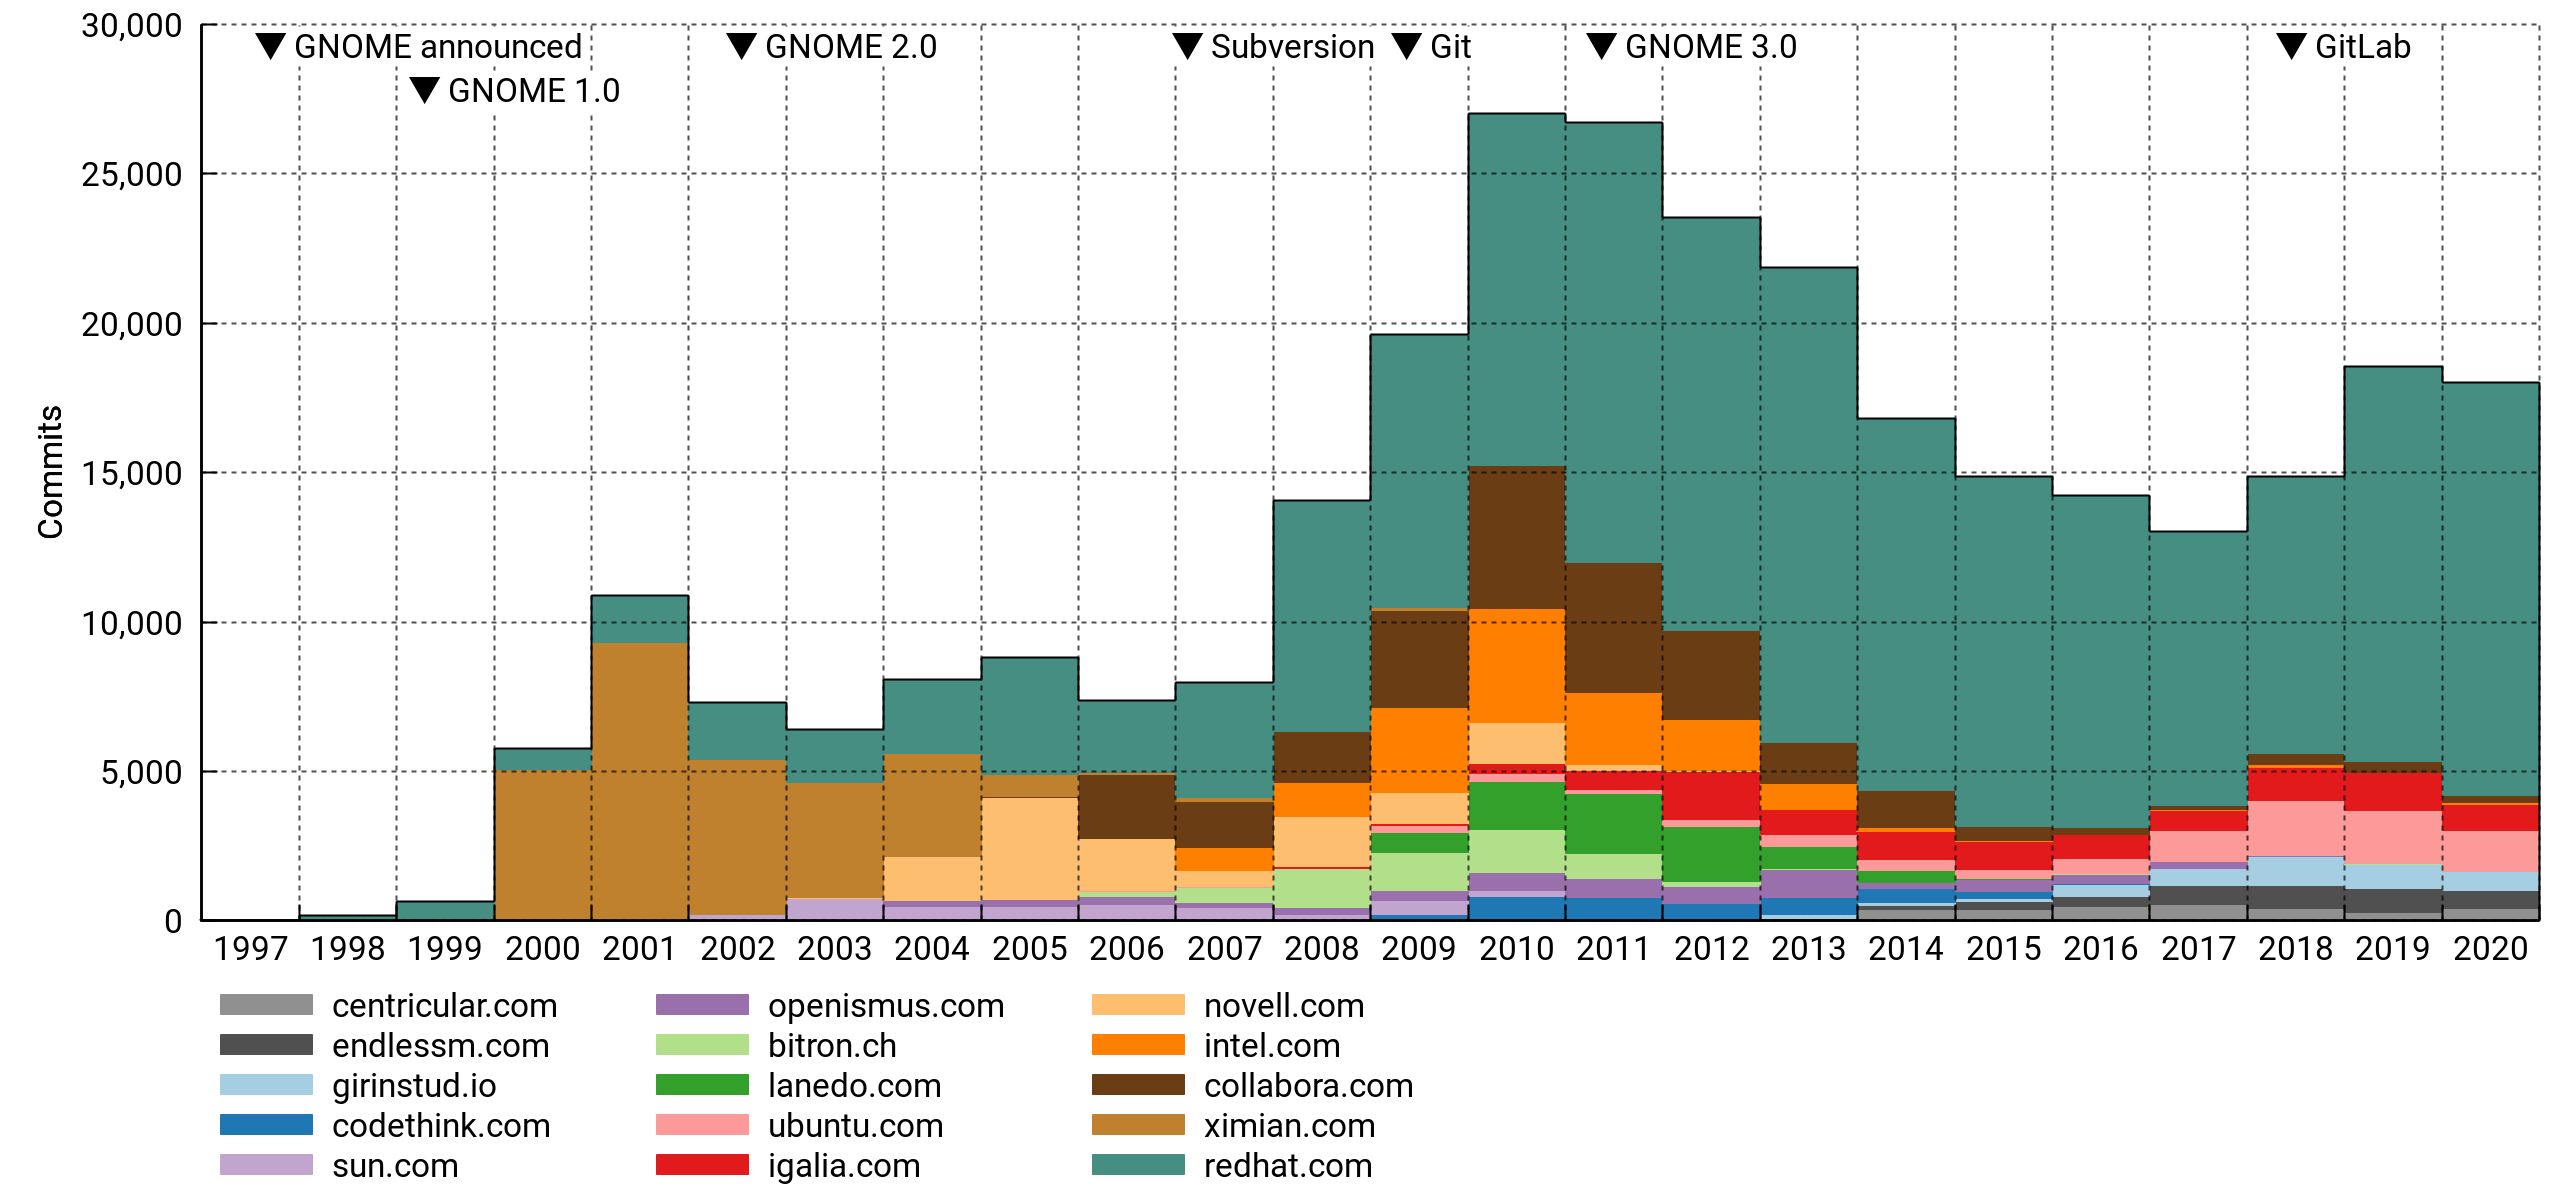
Top 15 affiliations again, but now ordered by commit counts. It's safe to say that GNOME is dependent on paid developers in a big way. Specifically, and to no one's surprise, it leans heavily on Red Hat.
General observations
A few observations can be made with confidence:
- By F/OSS standards, the project is not unhealthy. It has hundreds of experienced and first-time contributors every year. It is well-organized and arguably well-funded compared to its peers. But:
- Every metric has the project peaking around 2010.
- A diminishing number of veterans is doing an increasing share of the work.
- Although recruitment is stable, newcomers don't seem to be hitting their stride in terms of commits.
- Corporate sponsorship is probably necessary to keep the project going, but the field of sponsors has kept thinning.
I think GNOME is addressing the risk factors competently by modernizing infrastructure (GitLab, Discourse). This has obvious value even in the absence of quantifiable results, but it'll be interesting to see if the effect can be measured over the next couple of years.
Diminished enthusiasm may also be due to there being fewer ways for a new contributor to make their mark or assume a role of responsibility. GNOME has become more conservative, certainly much more so than it was a decade ago in the run-up to GNOME 3. The rationale and phrasing in the announcement of the new versioning scheme (e.g. "Radical technological and design changes are too disruptive for maintainers, users, and developers") seems indicative of this trend1.
Notes on methodology
So what's wrong with this analysis? If you're so inclined, you can find the details under the next couple of subheadings and pass harsh, harsh judgement.
I've set the unscientific rigor bar high enough to hopefully yield something useful, but low enough that I could do it in my spare time and not get stuck in the dreaded state commonly known as "90% done".
Module selection
I aggregated data from 189 Git repositories. The vast majority of these are hosted on gnome.org, with a handful from freedesktop.org and github.com. Commits are uniquely identified by their commit hash, meaning trivial duplicates are counted only once.
GNOME has always been a decentralized, big-tent project, so it's not obvious how to delineate it. I've tried to be fair by including most of the repositories from a full meta-gnome-desktop jhbuild, including fairly low-level dependencies like Cairo, Pango, and Pipewire, as well as past, present and would-be flagship applications under the GNOME umbrella. Documentation and infrastructure is represented, as are many archived projects (e.g. ORBit2, Bonobo, Sabayon, GAL).
I was a little uncertain about what to do with X.Org and Wayland. In the end I decided to include the latter, but not the former, since Wayland has close ties to GNOME (it even references GTK+ in its TODO file), while X.Org has its roots in the much older XFree86.
Mono is another project I resisted including; its development was tangential to GNOME proper, diverging completely in the most recent decade. However, I did include GtkSharp and several GNOME-hosted C# applications common on desktops in the 2005-2010 time frame.
Since I haven't established hard criteria for module selection, it's subject to various biases. Older code is probably underrepresented, since providers of important functionality were more loosely attached to the project early on (e.g. GNOME Online Accounts and Telepathy got pulled in, should I have included Gaim or Pidgin too? How about XChat?).
Anyway, the list isn't terrible, but there's room for improvement.
Contributor identities
Similar studies often identify contributors by their e-mail addresses. I used full author names instead, since there's good reason to think they're more stable over a 20-year time span. We're fairly consistent in spelling our own names, and we change them rarely (often never). On the other hand, e-mail addresses come and go with different hosting arrangements, employers, etc.
An added challenge with this approach is that sometimes different people have the exact same name. In practice, I'm not aware of any instances of this happening in GNOME. It seems to be rare enough that I doubt it'd introduce significant error in most projects.
I should add here that the drive-by cohort depends on a fair amount of hindsight (you never know when someone might come back with more contributions, but the likelihood drops off quickly as time passes). This means the cohorts for 2020 are preliminary. They'll be a lot more accurate with another run late next year.
Domain names
I'm using e-mail domain names as a proxy for organizations in some of the graphs. This is a notoriously unreliable approach for at least three reasons:
- Contributors often use personal e-mail addresses for paid work, leading to significant undercounting in general.
- Specific companies may require their employees (or ask them nicely) to use company e-mail for collaboration. Out of the listed companies, I know of at least one that definitely did this. However, there are many that don't, and these will be comparatively less well represented.
- The mapping between DNS and organizations isn't one-to-one. A company may operate under multiple names or TLDs (e.g.
.co.ukand.com).
Despite these weaknesses, it's common to slice the data this way. It's difficult to do better without access to semi-closed data troves, and depending on your views on privacy and ability to handle PII safely, it might not be something you'd want to get into anyway. But I bet you'd be well-positioned for it if you were, say, the corporate owner of both LinkedIn and GitHub.
When grouping by organization, the goal is to get an idea of which outside entities are sponsoring contributions. Therefore, I've filtered out addresses from the biggest mass e-mail providers like @gmail.com and project-centric providers of personal accounts (e.g. @gnome.org, @gtk.org).
I took the liberty of reassigning the personal domains of a few extra prolific authors who would've otherwise showed up as individual organizations. Since there's no way I'm doing it for everyone, this introduces some bias. The full details are in the project's metadata file (see: code).
Version control systems
Changeovers in version control systems divide GNOME's VCS history into three eras with noticeable discontinuities between them.
Before 1998: Dark ages
In the Bad Old Days, Free Software would often use plain RCS or no version control at all. I have basically no data for this era: The GIMP, being the ur-project from which GTK+ spawned, was imported to CVS in November 1997, but by then it had already been in development since at least mid-1995. It may be possible to reconstruct it somewhat by diffing old tarball releases. Linux historians have done this for the kernel.
1998-2009: Centralized
GNOME projects were mostly maintained in CVS from 1998 on, with infrastructure provided by Red Hat. A few companies (e.g. Ximian) maintained projects in their own CVS instances that were later consolidated under GNOME.
CVS had many limitations. For instance, history edits and other complex operations — like, oh, renaming a file — fell under the technical term "surgery" and the auspices of a competent server-side surgeon. The centralization of accounts also fostered a workflow where outside contributions were committed without any formal authorship metadata. This shows up in my plots as undercounting of active contributors.
GNOME moved to Subversion in 2007. While technically superior to CVS, it was still a centralized file-tracking solution and didn't change the workflow very much.
2009-present: Decentralized
Subversion didn't last long; 2009 saw the move to Git. The active contributor count shot up that year, and part of this is due to more accurate authorship metadata. I think there's a case to be made that involvement had been gradually increasing even before Git's introduction, but moving to a proper DVCS certainly didn't hurt.
Since a lot of contributors moved off @gnome.org in this switch, and affiliations are assigned based on e-mail addresses, the discontinuity is most visible in these graphs.
I expected the improved history management (and reduced commit anxiety) in Git's wake would also have produced more numerous commits. The data doesn't really bear this out — the count did increase the following year, but it's hard to distinguish from the general momentum leading up to GNOME 3.
Code
I wrote a small program to automate this somewhat. It's nothing much, but at least it can serve as a humorous example of what can happen when your reach starts to exceed awk's grasp and it occurs to you that hey, I should use Rust for scripting!
CSV files
I've uploaded the report data used in the charts in CSV format. It should be fairly self-explanatory and can be imported directly in LibreOffice (UTF-8, comma-separated).
Disclaimer
According to a quick tally, I've done enough work on GNOME projects for a place in the top 3% of committers2. That's decent enough, but the lion's share of it is, shall we say, not very recent. I don't presume to speak for the project or, in fact, any group at all.
1 Not necessarily a bad thing. There's something to be said for not constantly yanking the rug out from beneath everyone's feet.
2 Humblebrag aside, I'd like to emphasize that since there are so many small contributions ("long tail"), it's easy to end up in a high percentile even with a modest commitment.
This is something of a challenge with any large mature project, whether open or closed. While there's always space to work around the edges, work around the core of the project typically becomes less frequent… and that makes it much harder to train newer developers to deal with it. If you're not careful, you end up with the most critical parts of the project being maintained by a handful of aging veterans, with no successors in sight.
This rings true.
This is super interesting, and looks like you spent a whole lot of time on it, so thanks!
Indeed nothing in the data surprised me much — apart from Jũrg Billeter (bitron.ch) contributing more than most organisations between 2007 and 2011.
Analysis of corporate contributions is always interesting, as I think many folks outside the project have a perception that GNOME is a business with hundreds of paid developers of its own, rather than a volunteer-drive foundation. One thing that would be interesting to see is how many paid contributors also volunteer time — I have a feeling there are plenty of commits from @redhat.com emails which happen at the weekend, for example…
Yes, Jürg's in the top 50. I didn't want to focus too strongly on individuals for various reasons, but the curve is very steep on the high end. The top committer has 7-8x as many commits as him. I cleared out a couple of personal domains, but left bitron.ch in, as it seems to be a registered legal entity. A fine distinction, but you have to draw the line somewhere!
Looking at work-week distributions is an interesting idea. I have the same feeling that there's a big gray area between paid and volunteer work.
Very nice and interesting analysis. It reminds me a bit of my master thesis, where I've done a similar analysis of the GNOME project:
https://www.dgsiegel.net/talks/foss-development-processes
Oh, I hadn't seen that. It looks really interesting, especially as it's comparing multiple different communities.Thanks for posting it!
Interesting, thanks for taking the time to put this together!
Thanks for compiling this data!
One explanation for the peak achieved in 2010 is that we had an "all hands on deck" for the 3.0 release; we had a lot of components being ported to GTK3, a lot of deprecations, and an overall consolidation of projects. It would be interesting to see the trend lines for the amount of modules were added and removed from what we consider "GNOME" over the years.
Agreed. Maybe a per-module breakdown of commits/authors would work? Then you'd see where work was phased in and out for the various modules, and maybe also which ones are in danger of becoming understaffed.
Thanks for doing this, Hans! It's really useful and interesting. Is it possible to see the numbers that the charts are generated from?
Sure! The numbers are being passed to Gnuplot in CSV tables, so this is possible. I'll put them up in a bit and ping you when it's done.
Thank you very much for doing this analysis and sharing it in such a well-structured and easy-to-understand way!
If anyone is interested in helping move this research further, I would suggest following up on:
* measuring release management and code review work (the CHAOSS folks may have some tips on how to do this), since often those review-and-release cycles are bottlenecks that stop new contributors from being able to learn, grow, see their work in released software, etc.
* the contributor affiliations research to get further in understanding what proportion of contributions are employer-motivated, and to get more data on the set of employers. I think understanding that would help GNOME Foundation, funders, recruiters, mentors, etc. better understand which companies are (and which companies are not) contributing, and thus target their requests for time and money
Those are good ideas. I don't have a good handle on what tools are already available in GitLab to do this, but I think especially visualizing merge request activity (over time, per module, counting comments…) would indeed enable us to address this barrier to entry more directly.
Can you do the same for KDE?
I've been thinking about doing a few more projects, including KDE. I'll probably get around to it next year — most of the work is in finding and selecting the modules, and figuring out the list of personal domains/employment status for the most productive contributors.
Someone already did it in a bit less extensive form: https://carlschwan.eu/2021/04/29/health-of-the-kde-community/
It's good stuff. Interestingly, it has the hump around 2009 followed by a bumpy plateau, much like GNOME.
Thinking about this some more, if you chop off the peak around 2010, all the metrics show a fairly steady number of contributors, commits, etc. from 2008 through to the present. Perhaps the interpretation should not be that GNOME has been in decline since 2010, but more that the peak around 2010 was an outlier.
What happened around 2009/2010 which brought a huge load of developers to the platform who (largely) haven’t stuck around? Maemo/MeeGo?
I think it's a combination of factors. Some of it is likely undercounting of contributors, particularly in the drive-by group, before Git was introduced in 2009. The discontinuity in the dataset is pretty sharp, and the change in accounting is especially visible in the domain-based cohorts.
You're right that there was also a lot going on around then. Maybe it's instructive to look at which companies are winding down on the downslope. Some of it is going to be Moblin etc. ending. Sun goes away too, then Novell withdraws (cf. C#) and developers transfer to companies/accounts that are not well represented in the statistics later on.
In any case, recruitment (in terms of new developers or new projects) didn't keep up with attrition, and it seems dubious to me to arbitrarily disregard some of the activity in 2008-2014 as an excess.
It's not easy to tell from the charts if overall changes are due to increased attrition (as a percentage of previous year) or reduced recruiting — if you look at the incoming and drive-by cohorts post-2009, they actually decline slowly over many years. If I get the time, I'd like to add a chart type that, for each year, shows % reduction across all prior cohorts and the increase from the incoming cohort side by side.
I have an opinion that switching to GitLab is a tipping point for Gnome. This lowers barriers for newcomers.
I personally tried to contribute like 10 years ago (sent a patch to GTranslator). But this year it became much easier. A dozen of MRs and satisfaction of seeing your work in 3.38.
Semi-related: I do not like what happened this year with Hacktoberfest, so preferred to skip it and direct my coding-itch to Gnome apps.
Nice to hear that things are improving. I think the technical state of the project is the best it's ever been, and GTK 4 was just released too. There are many reasons to be optimistic.
The decline after 2010 was likely partially due to Ubuntu dropping Gnome with their 11.04 release and switching to Unity. Ubuntu switched to Gnome 3 with their 17.10 release.
Good point. I've gotten a lot of good input on the analysis. There are various improvements that can be made so it'd be easier to figure out exactly what's happening.
There is a wider issue, that somewhat formal, cross platform projects are "boring", too much effort compares to single-language repos on GitHub, as argued by a Fedora guy here:
https://fedoramagazine.org/fedora-present-and-future-a-fedora-next-2014-update-part-i-why/
«While, out in the world….
* 10 _million_ repos on GitHub
* Base OS considered boring
* Distro effort/reward balance changed
* Not just us: Debian, Ubuntu, openSUSE, Slackware all _no longer cool.
Even if we go with the rule that 90% of everything is crap, 10 million repos
is still a large number, and much larger than the 14,000-some packages in
Fedora. There’s just no way we could possibly capture all of that, and it is a
lot of open source developer energy happening in a space that we’re not
playing in. Also: the base OS has developed to the point where it has become
uninteresting.»
I think part of the goal has been to make the platform "boring" in the sense that it should be stable and predictable. Maybe that makes it less exciting, I don't know.
On the other hand, the Linux kernel is like that, and it's had a stellar trajectory with sustained growth since 2000. I made a chart on it that I'm saving for later.
Another thing I suspect is going on with Github is that people are forking mature projects and making spinoffs that never get upstreamed. Consensus building and patch review is often a lot more time consuming (and frustrating) than simply writing some code that's "good enough" for your own use but couldn't pass the bar upstream, especially when the maintainer has been around for decades and has developed strong preferences for how Things Should Be Done.
I'm gathering notes for an article I might write on it at some point. Possibly, maybe.
There are a lot of people translating with each getting a single commit for whatever has been translated. During the year you get larger chunks of text to translate, then shortly before the release you finish up smaller tasks, clean up translations and you end up with lots of commits for a lot of work but it's not code. Not to discount translations bit you have a lot of very small commits.
There are many translation updates, but the top 100 committers or so are all code contributors.Ok, went over this with a fine-toothed comb — I found 13 in the top 100 who seem to have contributed almost exclusively translations. Some of them contributed to documentation and infrastructure too, though. It's definitely something to look into more (the GH repo has an open issue on it).Commit count in general is a bit tricky. I think the active contributor count is the most reliable statistic if you want to take the pulse of the project.
Translators dominate if you count changed lines. The impression I got was that a big share of the anomalously big commits are translation updates, but that it's a much smaller share of commits generally than code is. I didn't publish any changed-lines charts because it's just really noisy data (e.g. huge chunks of text being moved around).